|
|
|
|
-
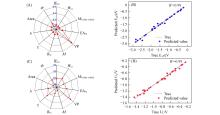 Fig.8
Feature importance analysis of descriptor(A) and prediction of adsorption energy under GBR method(B), feature importance analysis of descriptor(C) and prediction of UL under GBR method(D)
Fig.8
Feature importance analysis of descriptor(A) and prediction of adsorption energy under GBR method(B), feature importance analysis of descriptor(C) and prediction of UL under GBR method(D)
-
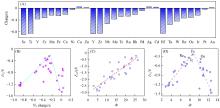 Fig.7
Mulliken charge of adsorbed N2(A), volcanic relation between UL andN2 charges(B), linear relationship between Ead and Φ(C), volcanic relation between UL and Φ(D)
Fig.7
Mulliken charge of adsorbed N2(A), volcanic relation between UL andN2 charges(B), linear relationship between Ead and Φ(C), volcanic relation between UL and Φ(D)
-
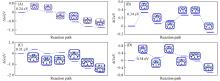 Fig.6
NRR reaction paths on CN⁃B@Fe2(A), CN⁃B@Tc2(B), CN⁃B@Re2(C) and CN⁃B@Os2(D)Insets: structural diagram represents the adsorption configuration of each step of reaction.
Fig.6
NRR reaction paths on CN⁃B@Fe2(A), CN⁃B@Tc2(B), CN⁃B@Re2(C) and CN⁃B@Os2(D)Insets: structural diagram represents the adsorption configuration of each step of reaction.
-
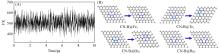 Fig.5
Temperature fluctuations in AIMD simulations for 10 ps(A) and structure of catalyst before and after 10 ps AIMD simulation(B)
Fig.5
Temperature fluctuations in AIMD simulations for 10 ps(A) and structure of catalyst before and after 10 ps AIMD simulation(B)
-
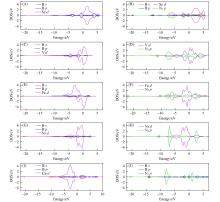 Fig.4
Density of states(DOS) of N2 before(A, C, E, G, I) and after(B, D, F, H, J) adsorption on CN⁃B@Sc2(A, B), CN⁃B@V2(C, D), CN⁃B@Fe2(E, F), CN⁃B@Ni2(G, H) and CN⁃B@Cu2(I, J) catalysis
Fig.4
Density of states(DOS) of N2 before(A, C, E, G, I) and after(B, D, F, H, J) adsorption on CN⁃B@Sc2(A, B), CN⁃B@V2(C, D), CN⁃B@Fe2(E, F), CN⁃B@Ni2(G, H) and CN⁃B@Cu2(I, J) catalysis
-
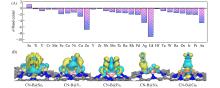 Fig.3
d Band centers for all catalyst(A), differential charge density distribution of N2 after adsorption to CN⁃B@Sc2, CN⁃B@V2, CN⁃B@Fe2, CN⁃B@Ni2 and CN⁃B@Cu2(B)
Fig.3
d Band centers for all catalyst(A), differential charge density distribution of N2 after adsorption to CN⁃B@Sc2, CN⁃B@V2, CN⁃B@Fe2, CN⁃B@Ni2 and CN⁃B@Cu2(B)
-
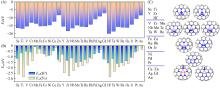 Fig.2
Formation energy of all CN⁃B@M2 catalysts(A), adsorption energy of H+ and N2 in all CN⁃B@M2 catalysts(B) and the most stable adsorption configuration of N2 on all N⁃B@M2 catalysts(C)
Fig.2
Formation energy of all CN⁃B@M2 catalysts(A), adsorption energy of H+ and N2 in all CN⁃B@M2 catalysts(B) and the most stable adsorption configuration of N2 on all N⁃B@M2 catalysts(C)
-
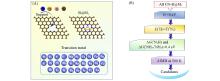 Fig.1
Modeling details(A) and screening procedures(B) of CN⁃B@M2 catalystsAIMD: Ab initio molecular dynamics.
Fig.1
Modeling details(A) and screening procedures(B) of CN⁃B@M2 catalystsAIMD: Ab initio molecular dynamics.
-
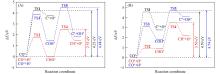 Fig.10
Reaction barriers of CO direct and H assisted dissociation on FeC@graphene(A) and Fe2C@graphene(B)
Fig.10
Reaction barriers of CO direct and H assisted dissociation on FeC@graphene(A) and Fe2C@graphene(B)
-
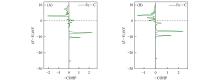 Fig.9
-COHP of FeC@graphene⁃CO(A) and Fe2C@graphene⁃CO(B)
Fig.9
-COHP of FeC@graphene⁃CO(A) and Fe2C@graphene⁃CO(B)
-
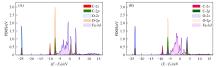 Fig.8
PDOSs of FeC@graphene⁃CO(A) and Fe2C@graphene⁃CO(B)
Fig.8
PDOSs of FeC@graphene⁃CO(A) and Fe2C@graphene⁃CO(B)
-
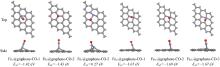 Fig.7
Top and side views of structures of FeC@graphene⁃CO and Fe2C@graphene⁃COC atoms are gray; Fe atom is blue; O atom is red.
Fig.7
Top and side views of structures of FeC@graphene⁃CO and Fe2C@graphene⁃COC atoms are gray; Fe atom is blue; O atom is red.
-
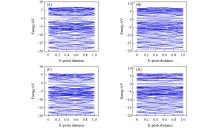 Fig.6
Band structures of FeC@graphene(A), Fe2C@graphene(B), FeC@graphene⁃CO(C) and Fe2C@graphene⁃CO(D)
Fig.6
Band structures of FeC@graphene(A), Fe2C@graphene(B), FeC@graphene⁃CO(C) and Fe2C@graphene⁃CO(D)
-
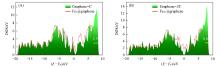 Fig.5
DOSs of graphene-C, FeC@graphene(A) and graphene-2C, Fe2C@graphene(B)E-EF represents the energy difference between the electron energy(E) and EF.
Fig.5
DOSs of graphene-C, FeC@graphene(A) and graphene-2C, Fe2C@graphene(B)E-EF represents the energy difference between the electron energy(E) and EF.
-
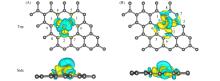 Fig.4
Deformed charge density of FeC@graphene(A) and Fe2C@graphene(B)
Fig.4
Deformed charge density of FeC@graphene(A) and Fe2C@graphene(B)
-
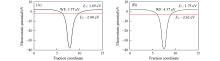 Fig.3
Work function(WF) of FeC@graphene(A) and Fe2C@graphene(B)EV: vacuum level; EF: Fermi level.
Fig.3
Work function(WF) of FeC@graphene(A) and Fe2C@graphene(B)EV: vacuum level; EF: Fermi level.
-
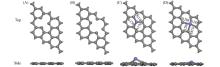 Fig.2
Top and side views of structures of graphene-C(A), graphene-2C(B), FeC@graphene(C) and Fe2C@graphene(D)C atoms are gray, Fe atom is blue.
Fig.2
Top and side views of structures of graphene-C(A), graphene-2C(B), FeC@graphene(C) and Fe2C@graphene(D)C atoms are gray, Fe atom is blue.
-
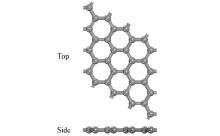 Fig.1
Top and side views of structures of graphene
Fig.1
Top and side views of structures of graphene
-
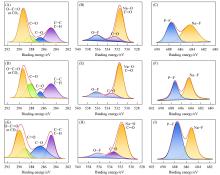 Fig.12
XPS spectra of C1s (A, D, G), O1s (B, E, H), F1s (C, F, I) of HC after 10 cycles in different electrolytes of EC/PC(A—C), EC/DMC(D—F) and EC/PC/DMC(G—I)
Fig.12
XPS spectra of C1s (A, D, G), O1s (B, E, H), F1s (C, F, I) of HC after 10 cycles in different electrolytes of EC/PC(A—C), EC/DMC(D—F) and EC/PC/DMC(G—I)
-
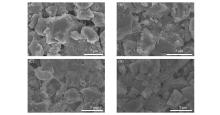 Fig.11
SEM images of HC after 10 cycles in different electrolytes of EC/PC/DMC(A), EC/DMC(B) and EC/PC(C), pristine HC(D)
Fig.11
SEM images of HC after 10 cycles in different electrolytes of EC/PC/DMC(A), EC/DMC(B) and EC/PC(C), pristine HC(D)
|
|