

高等学校化学学报 ›› 2018, Vol. 39 ›› Issue (11): 2395.doi: 10.7503/cjcu20180272
李雯雯1,3, 朱爱如2, 龙怡静2, 王春燕2, 韩源平2, 段忆翔2,3( )
)
收稿日期:2018-04-09
出版日期:2018-11-10
发布日期:2018-10-16
作者简介:联系人简介: 段忆翔, 男, 博士, 教授, 主要从事基于代谢组学的医学诊断以及生物传感器方面的研究. E-mail: 基金资助:
LI Wenwen1,3, ZHU Airu2, LONG Yijing2, WANG Chunyan2, HAN Yuanping2, DUAN Yixiang2,3,*()
Received:2018-04-09
Online:2018-11-10
Published:2018-10-16
Contact:
DUAN Yixiang
E-mail:yduan@scu.edu.cn
Supported by:摘要:
采用高脂与维生素D缺乏(VDD)饮食长期(24周)喂养小鼠, 诱导其形成2型糖尿病(T2DM), 通过小鼠血清和肝脏代谢组学分析探究了T2DM发生、 发展的代谢物和代谢通路变化机制. 实验收集小鼠血清和肝脏样品, 通过气相色谱-质谱联用技术和硅烷化衍生方法分析得到血清和肝脏代谢轮廓; 利用正交偏最小二乘判别分析和非参数检验筛选血清和肝脏代谢组中具有显著性差异的代谢标志物, 发现血清样品中乳酸、 丙氨酸、 甘油、 苏氨酸和葡萄糖含量在高脂+VDD小鼠中显著升高, 肝脏样品中乳酸、 核糖、 果糖、 葡萄糖、 油酸和棕榈酸含量在高脂+VDD小鼠中显著升高. 本文还进行了血清和肝脏代谢轮廓整体分析和代谢通路探索, 发现高脂+VDD小鼠中三羧酸循环、 糖异生、 氨基酸以及脂质代谢通量均显著增强, 这些代谢路径相互影响共同促进T2DM的发生和发展. 本文通过饮食诱导小鼠形成T2DM, 得到血清和肝脏代谢物及其代谢通路的变化关系, 可为T2DM诊断提供参考信息.
中图分类号:
TrendMD:
李雯雯, 朱爱如, 龙怡静, 王春燕, 韩源平, 段忆翔. 高脂与维生素D缺乏饮食诱导的2型糖尿病小鼠血清和肝脏代谢组学研究. 高等学校化学学报, 2018, 39(11): 2395.
LI Wenwen, ZHU Airu, LONG Yijing, WANG Chunyan, HAN Yuanping, DUAN Yixiang. Metabolomics Study of Serum and Liver in Type 2 Diabetes Mice Induced by High Fat Diet with Vitamin D Deficiency†. Chem. J. Chinese Universities, 2018, 39(11): 2395.
| Parameter | Control(mean±SE) | HD(mean±SE) |
|---|---|---|
| Mass/g | 33.57±0.71 | 45.47±2.14* |
| Visceral fat coefficient(%) | 2.70±0.32 | 7.50±0.74* |
| FPB/(mmol·L-1) | 5.20±0.24 | 8.90±0.31* |
| HOMA-IR(fold) | 1.0 | 1.7* |
| Total cholesterol/(mmol·L-1) | 3.33±0.22 | 4.94±0.33* |
| Triglyceride/(mmol·L-1) | 0.63±0.05 | 0.90±0.07* |
| Free fatty acid/(mmol·L-1) | 0.89±0.04 | 1.19±0.03* |
| LDL-C/(mmol·L-1) | 0.42±0.04 | 0.78±0.11* |
| HDL-C/LDL-C | 7.14±0.48 | 5.33±0.38* |
Table 1 Biochemical parameters for HD group and control group
| Parameter | Control(mean±SE) | HD(mean±SE) |
|---|---|---|
| Mass/g | 33.57±0.71 | 45.47±2.14* |
| Visceral fat coefficient(%) | 2.70±0.32 | 7.50±0.74* |
| FPB/(mmol·L-1) | 5.20±0.24 | 8.90±0.31* |
| HOMA-IR(fold) | 1.0 | 1.7* |
| Total cholesterol/(mmol·L-1) | 3.33±0.22 | 4.94±0.33* |
| Triglyceride/(mmol·L-1) | 0.63±0.05 | 0.90±0.07* |
| Free fatty acid/(mmol·L-1) | 0.89±0.04 | 1.19±0.03* |
| LDL-C/(mmol·L-1) | 0.42±0.04 | 0.78±0.11* |
| HDL-C/LDL-C | 7.14±0.48 | 5.33±0.38* |
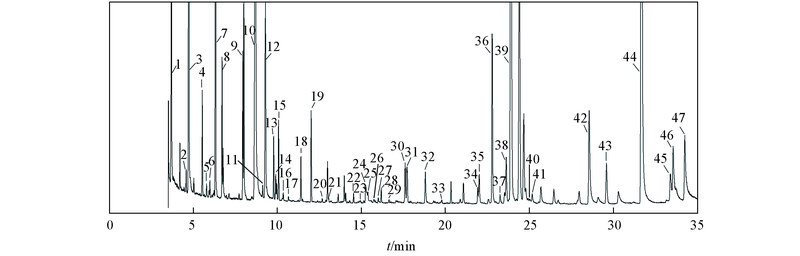
Fig.1 Total ion chromatogram of a serum samplePeak: 1. hexanol; 2. pyruvic acid**; 3. L-lactic acid**; 4. L-Alanine**; 5. hydroxylamine; 6. 2-hydroxybutyric acid*; 7. oxalic acid; 8. 3-hydroxybutyric acid; 9. L-valine; 10. urea**; 11. ethanol amine; 12. glycerol**; 13. L-isoleucine; 14. L-proline**; 15. glycine; 16. succinic acid*; 17. glyceric acid*; 18. L-serine**; 19. L-threonine**; 20. 2,4-dihydroxybutyric acid; 21. β-alanine; 22. malic acid; 23. erythritol; 24. L-methionine**; 25. 5-oxoproline; 26. erythronic acid; 27. creatinine*; 28. threonic acid**; 29. α-ketoglutarate; 30. L-glutamic acid*; 31. L-phenylalanine; 32. ribose; 33. ribitol; 34. L-ornithine; 35. citric acid; 36. 1-deoxyglucose*; 37. fructose**; 38. mannose; 39. glucose**; 40. glucitol; 41. L-tyrosine; 42. palmitic acid; 43. inositol*; 44. heptadecanoic acid; 45. linoleic acid; 46. oleic acid; 47. stearic acid. Metabolites confirmed with standards are in bold, statistical significance between control and HD group, * P<0.05, ** P<0.01.
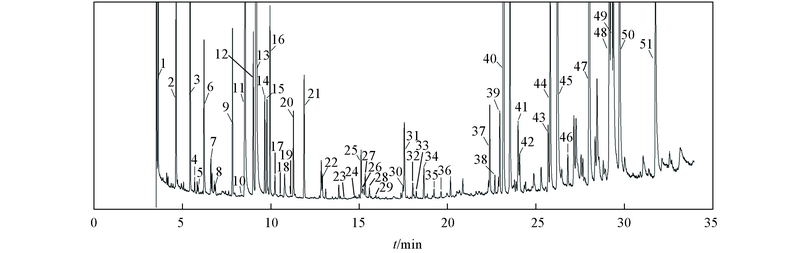
Fig.2 Total ion chromatogram of a liver samplePeak: 1. hexanol; 2. L-lactic acid*; 3. L-alanine; 4. hydroxylamine*; 5. 2-hydroxybutyric acid*; 6. oxalic acid; 7. 3-hydroxybutyric acid; 8. 2-aminobutyric acid*; 9. L-valine*; 10. 4-hydroxybutyric acid; 11. urea*; 12. ethanol amine**; 13. glycerol; 14. L-isoleucine*; 15. L-proline; 16. glycine; 17. succinic acid*; 18. glyceric acid*; 19. fumaric acid**; 20. L-serine; 21. L-threonine; 22. β-alanine**; 23. malic acid**; 24. erythritol**; 25. L-methionine*; 26. 5-oxoproline; 27. 4-aminobutyric acid; 28. 2,6-ditertbutylphenol; 29. cysteine; 30. L-glutamic acid; 31. L-phenylalanine; 32. xylose**; 33. lauric acid**; 34. ribose**; 35. xylitol; 36. ribitol; 37. myristic acid; 38. fructose**; 39. mannose**; 40. glucose**; 41. glucitol; 42. L-tyrosine; 43. palmitelaidic acid*; 44. palmitoleic acid; 45. palmitic acid**; 46. inositol; 47. heptadecanoic acid; 48. linoleic acid; 49. oleic acid*; 50. stearic acid; 51. arachidonic acid. Metabolites confirmed with standards are in bold, * P<0.05, ** P<0.01.
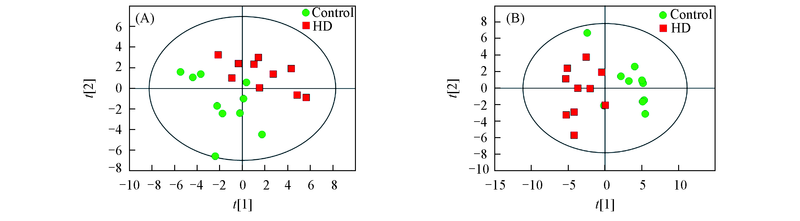
Fig.3 Principal component analysis score plots for metabolic profiling of serum(A) and liver(B) samples in HD group and control group(A) R2X[1]=0.14, R2X[2]=0.1; (B) R2X[1]=0.181, R2X[2]=0.0884.
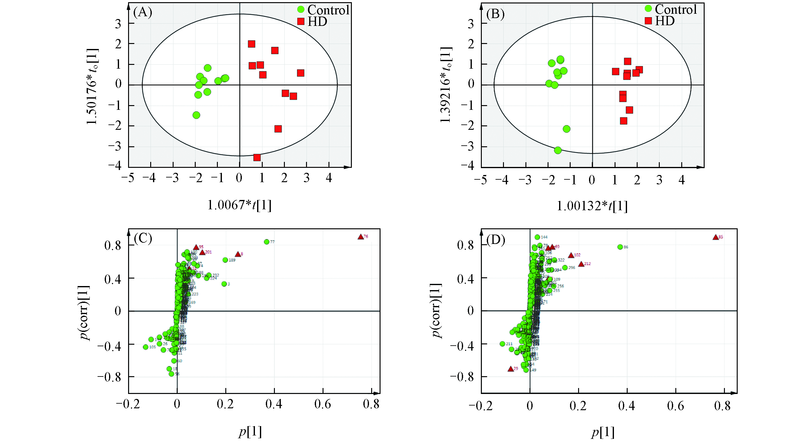
Fig.4 Orthogonal partial least squares-discriminant analysis(OPLS-DA) score plots for metabolic profiling of serum(A) and liver(B) samples in HD group and control group and S-plots of variablesin serum(C) and liver(D)(A) R2X[1]=0.35; R2X[X side comp. 1]=0.217; (B) R2X[1]=0.305; R2X[X side comp.1]=0.172; (C) R2X[1]=0.35; (D) R2X[1]=0.305. (C) and (D): red triangles are metabolic biomarkers with VIP>1 and statistical significance P<0.05.
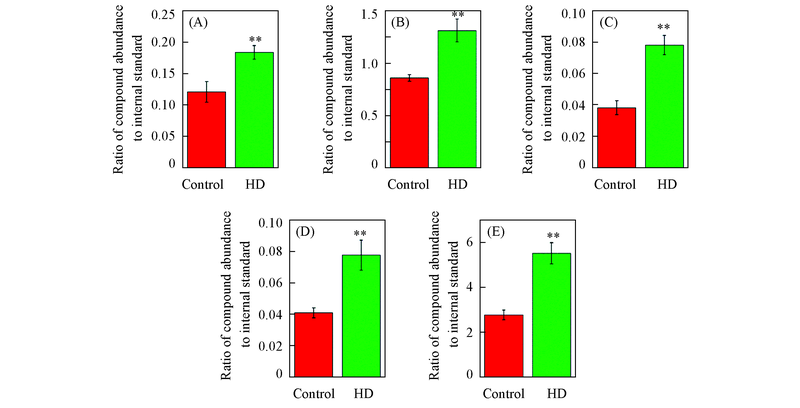
Fig.5 Serum metabolic biomarkers for T2DM(** P<0.01)(A) Glyccrol; (B) lactic acid; (C) Ala; (D) Thr; (E) glucose.
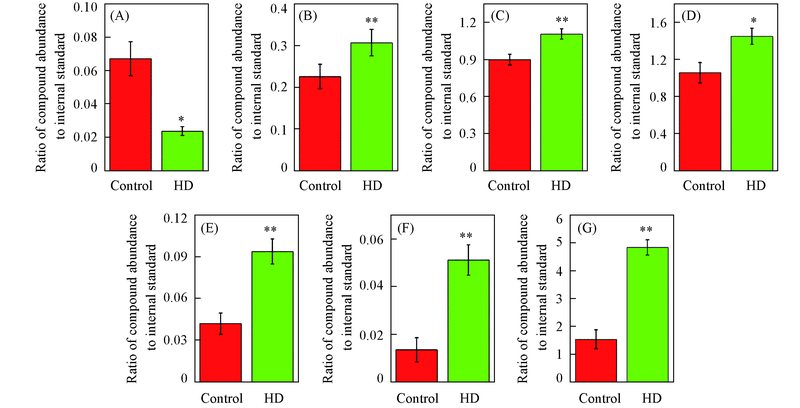
Fig.6 Liver metabolic biomarkers for T2DM(* P<0.05, ** P<0.01)(A) Ethanolamine; (B) lactic acid; (C) palmitic acid; (D) oleic acid; (E) ribose; (F) fructose; (G) glucose.
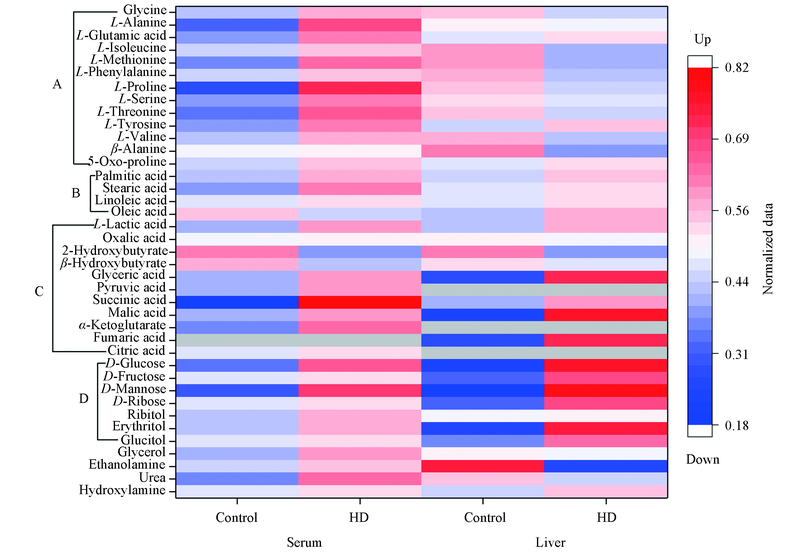
Fig.7 Heat map for serum and liver metabolites in HD group and control groupA, B, C and D represent amino acids, fatty acids, organic acids, and carbohydrates and alditol, respectively. Red color and blue color indicate up-regulated and down-regulated, grey color represents absence.
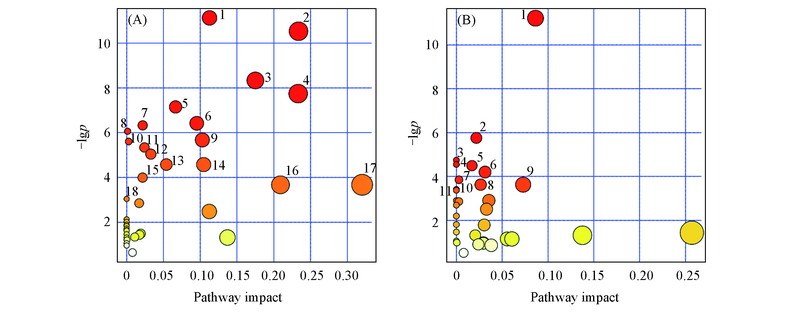
Fig.8 Metabo analyst pathway analysis for serum(A) and liver(B) metabolitesNumbers in the plots are metabolic pathways listed in Table 2 and Table 3, respectively.
| No. | Pathway name | P | Impact | KEGG |
|---|---|---|---|---|
| 1 | Aminoacyl-tRNA biosynthesis* | 0 | 0.113 | map00970 |
| 2 | Alanine, aspartate and glutamate metabolism* | 0 | 0.234 | map00250 |
| 3 | Arginine and proline metabolism* | 0 | 0.175 | map00330 |
| 4 | Glycine, serine and threonine metabolism* | 0 | 0.233 | map00260 |
| 5 | Cysteine and methionine metabolism* | 0.001 | 0.067 | map00270 |
| 6 | Glycolysis or Gluconeogenesis* | 0.002 | 0.095 | map00010 |
| 7 | Pentose phosphate pathway | 0.002 | 0.022 | map00030 |
| 8 | Propanoate metabolism | 0.002 | 0.001 | map00640 |
| 9 | Butanoate metabolism* | 0.003 | 0.103 | map00650 |
| 10 | Galactose metabolism* | 0.004 | 0.003 | map00052 |
| 11 | Ascorbate and aldarate metabolism | 0.005 | 0.024 | map00053 |
| 12 | Glyoxylate and dicarboxylate metabolism* | 0.006 | 0.033 | map00630 |
| 13 | Taurine and hypotaurine metabolism | 0.010 | 0.054 | map00430 |
| 14 | Citrate cycle(TCA cycle)* | 0.010 | 0.105 | map00020 |
| 15 | Valine, leucine and isoleucine biosynthesis | 0.018 | 0.022 | map00290 |
| 16 | Glycerolipid metabolism* | 0.025 | 0.209 | map00561 |
| 17 | Pyruvate metabolism* | 0.025 | 0.320 | map00620 |
| 18 | Phenylalanine metabolism | 0.048 | 0 | map00360 |
Table 2 Significant pathways for serum metabolites
| No. | Pathway name | P | Impact | KEGG |
|---|---|---|---|---|
| 1 | Aminoacyl-tRNA biosynthesis* | 0 | 0.113 | map00970 |
| 2 | Alanine, aspartate and glutamate metabolism* | 0 | 0.234 | map00250 |
| 3 | Arginine and proline metabolism* | 0 | 0.175 | map00330 |
| 4 | Glycine, serine and threonine metabolism* | 0 | 0.233 | map00260 |
| 5 | Cysteine and methionine metabolism* | 0.001 | 0.067 | map00270 |
| 6 | Glycolysis or Gluconeogenesis* | 0.002 | 0.095 | map00010 |
| 7 | Pentose phosphate pathway | 0.002 | 0.022 | map00030 |
| 8 | Propanoate metabolism | 0.002 | 0.001 | map00640 |
| 9 | Butanoate metabolism* | 0.003 | 0.103 | map00650 |
| 10 | Galactose metabolism* | 0.004 | 0.003 | map00052 |
| 11 | Ascorbate and aldarate metabolism | 0.005 | 0.024 | map00053 |
| 12 | Glyoxylate and dicarboxylate metabolism* | 0.006 | 0.033 | map00630 |
| 13 | Taurine and hypotaurine metabolism | 0.010 | 0.054 | map00430 |
| 14 | Citrate cycle(TCA cycle)* | 0.010 | 0.105 | map00020 |
| 15 | Valine, leucine and isoleucine biosynthesis | 0.018 | 0.022 | map00290 |
| 16 | Glycerolipid metabolism* | 0.025 | 0.209 | map00561 |
| 17 | Pyruvate metabolism* | 0.025 | 0.320 | map00620 |
| 18 | Phenylalanine metabolism | 0.048 | 0 | map00360 |
| No. | Pathway name | P | Impact | KEGG |
|---|---|---|---|---|
| 1 | Propanoate metabolism# | 0 | 0.086 | map00640 |
| 2 | Pentose phosphate pathway | 0.003 | 0.022 | map00030 |
| 3 | Amino sugar and nucleotide sugar metabolism* | 0.009 | 0 | map00520 |
| 4 | Fatty acid biosynthesis | 0.011 | 0 | map00061 |
| 5 | Starch and sucrose metabolism* | 0.011 | 0.017 | map00500 |
| 6 | Citrate cycle(TCA cycle)* | 0.015 | 0.031 | map00020 |
| 7 | Alanine, aspartate and glutamate metabolism | 0.021 | 0.003 | map00250 |
| 8 | Valine, leucine and isoleucine biosynthesis# | 0.027 | 0.027 | map00290 |
| 9 | Pantothenate and CoA biosynthesis# | 0.027 | 0.073 | map00770 |
| 10 | Aminoacyl-tRNA biosynthesis# | 0.032 | 0 | map00970 |
| 11 | Glycolysis or Gluconeogenesis | 0.034 | 0 | map00010 |
Table 3 Significant pathways for liver metabolites
| No. | Pathway name | P | Impact | KEGG |
|---|---|---|---|---|
| 1 | Propanoate metabolism# | 0 | 0.086 | map00640 |
| 2 | Pentose phosphate pathway | 0.003 | 0.022 | map00030 |
| 3 | Amino sugar and nucleotide sugar metabolism* | 0.009 | 0 | map00520 |
| 4 | Fatty acid biosynthesis | 0.011 | 0 | map00061 |
| 5 | Starch and sucrose metabolism* | 0.011 | 0.017 | map00500 |
| 6 | Citrate cycle(TCA cycle)* | 0.015 | 0.031 | map00020 |
| 7 | Alanine, aspartate and glutamate metabolism | 0.021 | 0.003 | map00250 |
| 8 | Valine, leucine and isoleucine biosynthesis# | 0.027 | 0.027 | map00290 |
| 9 | Pantothenate and CoA biosynthesis# | 0.027 | 0.073 | map00770 |
| 10 | Aminoacyl-tRNA biosynthesis# | 0.032 | 0 | map00970 |
| 11 | Glycolysis or Gluconeogenesis | 0.034 | 0 | map00010 |
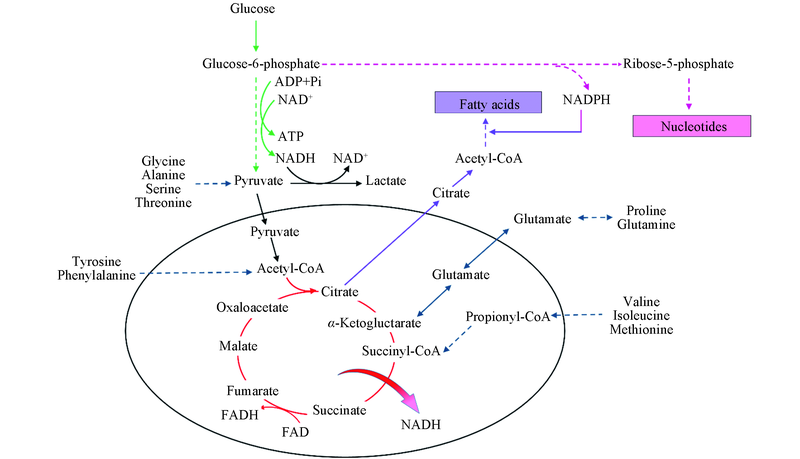
Fig.9 Network of metabolites and pathways in this workRed is TCA cycle; green is glycolysis; blue is amino acids into TCA cycle; pink is pentose phosphate pathway; purple is fatty acid synthesis.
| [1] | American Diabetes Association, Diabetes Care, 2014, 37(Suppl.1), S81—S90 |
| [2] | Taskinen M. R., Curr. Mol. Med., 2005, 5(3), 297—308 |
| [3] | Mathers C. D., Loncar D., PLoS Med., 2006, 3(11), e442 |
| [4] | International Diabetes Federation. IDF Diabetes Atlas: Eighth Edition., 2017, |
| [5] | Alberti K.G. M. M. Zimmet P. Z., Diabet Med., 1998, 15(7), 539—553 |
| [6] | de Lusignan S., Khunti K., Belsey J., Hattersley A., van Vlymen J., Gallagher H., Millett C., Hague N. J., Tomson C., Harris K., Majeed A., Diabet Med., 2010, 27(2), 203—209 |
| [7] | Zhang A. H., Qiu S., Xu H. Y., Sun H., Wang X. J., Clin. Chim. Acta, 2014, 429, 106—110 |
| [8] | Meiss E., Werner P., John C., Scheja L., Herbach N., Heeren J., Fischer M., Metabolomics, 2016, 12(3), 52 |
| [9] | Fiehn O., Plant Mol .Biol., 2002, 48, 155—171 |
| [10] | Vinayavekhin N., Homan E. A., Saghatelian A., ACS Chem. Biol., 2010, 5(1), 91—103 |
| [11] | Johnson C. H., Ivanisevic J., Benton H. P., Siuzdak G., Anal. Chem., 2015, 87(1), 147—156 |
| [12] | Oakes N. D., Cooney G. J., Camilleri S., Chisholm D. J., Kraegen E. W., Diabetes, 1997, 46(11), 1768—1774 |
| [13] | Lottenberg A. M., Afonso Mda S., Lavrador M. S., Machado R. M., Nakandakare E. R., J. Nutr. Biochem., 2012, 23(9), 1027—1040 |
| [14] | Kratz M., Baars T., Guyenet S., Eur. J. Nutr., 2013, 52(1), 1—24 |
| [15] | Flores M., Nutr. Res. Rev., 2007, 18(2), 175—182 |
| [16] | Cao L. J., Jiang P., Li H. D., He X., Zhu W. Y., Central South Pharmacy, 2014, 12(9), 844—847 |
| (曹玲娟, 江沛, 李焕德, 何昕, 朱文叶. 中南医学, 2014, 12(9), 844—847) | |
| [17] | Chiu K. C., Chu A., Go V. L. W., Saad M. F., Am. J. Clin. Nutr., 2004, 79(5), 820—825 |
| [18] | McCarty M. F., Thomas C. A., Med. Hypotheses, 2003, 61(5/6), 535—542 |
| [19] | Chagas C. E., Borges M. C., Martini L. A., Rogero M. M., Nutrients, 2012, 4(1), 52—67 |
| [20] | Wu S. M., Feng B., Cheng J. H., Li H. J., Fang J. J., Yan X. Z., Wei L., Dong F. T., Chem J Chinese Universities, 2012, 33(6), 1188—1194 |
| (吴胜明, 封波, 程建华, 李海静, 方均建, 颜贤忠, 魏来, 董方霆. 高等学校化学学报, 2012, 33(6), 1188—1194) | |
| [21] | Styczynski M. P., Moxley J. F., Tong L. V., Walther J. L., Jensen K. L., Stephanopoulos G. N., Anal. Chem., 2007, 79(3), 966—973 |
| [22] | Valenza F., Aletti G., Fossali T., Chevallard G., Sacconi F., Irace M., Gattinoni L., Crit. Care, 2005, 9(6), 588—593 |
| [23] | Felig P., Metabolism, 1973, 22(2), 179—207 |
| [24] | Attie A. D., Krauss R. M., Gray-Keller M. P., Brownlie A., Miyazaki M., Kastelein J. J., Lusis A. J., Stalenhoef A. F. H., Stoehr J. P., Hayden M. R., Ntambi J. M., J. Lipid. Res., 2002, 43(11), 1899—1907 |
| [25] | Lee J. J., Lambert J. E., Hovhannisyan Y., Ramos-Roman M. A., Trombold J. R., Wagner D. A., Parks E. J., Am. J. Clin. Nutr., 2015, 101(1), 34—43 |
| [26] | Wang T. J., Larson M. G., Vasan R. S., Cheng S., Rhee E. P., McCabe E., Lewis G. D., Fox C. S., Jacques P. F., Fernandez C., O’Donnell C. J., Carr S. A., Mootha V. K., Florez J. C., Souza A., Melander O., Clish C. B., Gerszten R. E., Nat. Med., 2011, 17(4), 448—453 |
| [27] | Huffman K. M., Shah S. H., Stevens R. D., Bain J. R., Muehlbauer M., Slentz C. A., Tanner C. J., Kuchibhatla M., Houmard J. A., Newgard C. B., Kraus W. E., Diabetes Care, 2009, 32(9), 1678—1683 |
| [28] | Satapati S., Sunny N. E., Kucejova B., Fu X., He T. T., Mendez-Lucas A., Shelton J. M., Perales J. C., Browning J. D., Burgess S. C., J. Lipid. Res., 2012, 53(6), 1080—1092 |
| [29] | Vessby B., Curr. Opin Lipidol, 2003, 14(1), 15—19 |
| [1] | 王天琦,余琼卫,冯钰锜. 基于氧化镍沉积硅胶固相萃取与液相色谱-质谱联用技术的2型糖尿病血清中咪唑丙酸的检测[J]. 高等学校化学学报, 2020, 41(2): 262. |
| [2] | 张楠茜, 吕经纬, 金平, 李晶峰, 边学峰, 张辉, 孙佳明. N-苄基十六碳酰胺促小鼠Leydig细胞增殖和分泌睾酮的 1H NMR代谢组学研究[J]. 高等学校化学学报, 2019, 40(9): 1832. |
| [3] | 王毅, 张苹, 吴生秀, 孙媛媛, 赵彤, 刘世熙. 质谱中反偶电子规则并含双电荷离子的两类联苯化合物的裂解机理[J]. 高等学校化学学报, 2018, 39(3): 435. |
| [4] | 黄玉, 谷彩云, 吴翰钟, 夏晓爽, 李新. 基于超高效液相色谱-四极杆飞行时间质谱的缺血性脑卒中的代谢组学研究[J]. 高等学校化学学报, 2017, 38(10): 1742. |
| [5] | 王曦烨, 单晓彤, 王伊林, 李丹, 赵明, 许良. 丹参多酚酸盐改善扩张性心肌病心肌功能的作用机制[J]. 高等学校化学学报, 2016, 37(5): 844. |
| [6] | 李鹏辉, 邓伶莉, 罗娇, 李巍, 宁晶, 丁健桦, 邬小萍. 多批次肝衰竭患者呼出气体的电喷雾萃取电离质谱检测及代谢组学数据分析[J]. 高等学校化学学报, 2016, 37(4): 626. |
| [7] | 杨永霞, 王琳琳, 郑凌云, 王淑美, 黄榕波, 张磊, 黄耀庭. 基于核磁共振氢谱代谢组学研究黄连解毒汤对胰岛素抵抗大鼠棕色脂肪组织代谢组的影响[J]. 高等学校化学学报, 2014, 35(9): 1883. |
| [8] | 张瑞兴, 刘舒, 皮子凤, 宋凤瑞, 刘志强. 汞离子对细胞代谢通路影响的代谢组学[J]. 高等学校化学学报, 2014, 35(6): 1146. |
| [9] | 陈琰, 刘桂锋, 刘霞, 张桂珍, 王振新. 应用微阵列芯片检测与2型糖尿病相关的单核苷酸多态性[J]. 高等学校化学学报, 2013, 34(5): 1078. |
| [10] | 梅桢, 蔡文生, 邵学广. 免疫算法用于复杂样品的GC-MS快速分析[J]. 高等学校化学学报, 2013, 34(4): 819. |
| [11] | 黄敏, 高建义, 翟志刚, 梁琼麟, 王义明, 白延强, 罗国安. 基于药代动力学和代谢组学研究咖啡因对异丙嗪镇静作用的影响[J]. 高等学校化学学报, 2013, 34(4): 829. |
| [12] | 成玉, 刘玉敏, 黄凤杰, 陈天璐, 郑晓皎, 赵爱华, 何品刚, 贾伟. 基于超高效液相色谱-四极杆飞行时间高分辨质谱的高通量血清代谢组学方法[J]. 高等学校化学学报, 2013, 34(1): 77. |
| [13] | 牛俊, 皮子凤, 越皓, 刘淑莹. 格列美脲治疗的2型糖尿病大鼠的尿液代谢组学研究[J]. 高等学校化学学报, 2012, 33(10): 2169. |
| [14] | 刘跃芹, 皮子凤, 宋凤瑞, 刘志强, 刘忠英. 阿卡波糖对Ⅱ型糖尿病大鼠尿液代谢轮廓的影响[J]. 高等学校化学学报, 2012, 33(09): 1932. |
| [15] | 吴胜明, 封波, 程建华, 李海静, 方均建, 颜贤忠, 魏来, 董方霆. 小鼠血清中内源性代谢物的GC/TOF-MS分析[J]. 高等学校化学学报, 2012, 33(06): 1188. |
| 阅读次数 | ||||||
|
全文 |
|
|||||
|
摘要 |
|
|||||