

Chem. J. Chinese Universities ›› 2015, Vol. 36 ›› Issue (6): 1052.doi: 10.7503/cjcu20150049
• Analytical Chemistry • Previous Articles Next Articles
WANG Erdan1, LU Lili1, ZHANG Taiming1,*( ), DONG Wenbin2, LU Hongmei1, LIANG Yizeng1, XU Tianshu1, ZHANG Juan1, CHEN Chunnan1
Received:2015-01-16
Online:2015-06-10
Published:2015-05-22
Contact:
ZHANG Taiming
E-mail:taimingzhang@163.com
Supported by:CLC Number:
TrendMD:
WANG Erdan, LU Lili, ZHANG Taiming, DONG Wenbin, LU Hongmei, LIANG Yizeng, XU Tianshu, ZHANG Juan, CHEN Chunnan. Non-linear Chemical Analysis of Throng Component and Simultaneous Determining Contents of Cow and Mare Milks Mixed with Goat Milk†[J]. Chem. J. Chinese Universities, 2015, 36(6): 1052.
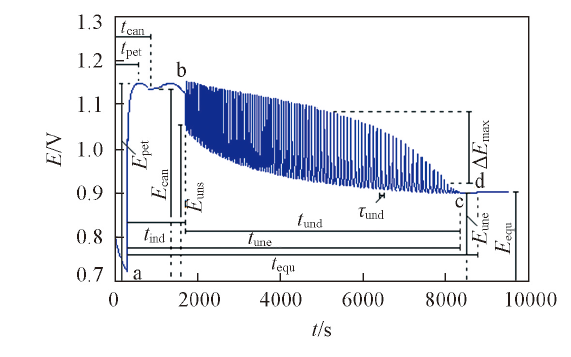
Fig.1 Basic characteristic information of non-linear chemical fingerprint of cow milkab: inductive curve; bc: undulatory curve; cd: potential drift curve; a and d are the start and end points of reaction, respectively.
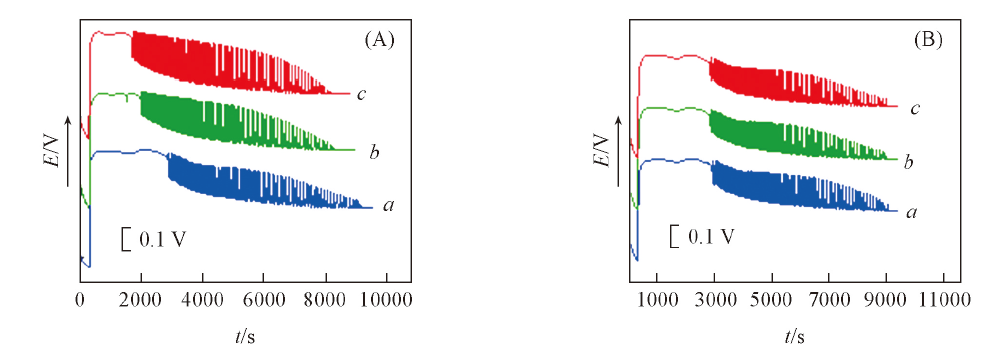
Fig.2 Characteristic difference between non-linear chemical fingerprints of goat milk(a), mare milk(b) and cow milk(c)(A) and reproducibility of non-linear chemical fingerprint(3 parallel determination) of goat milk(B)
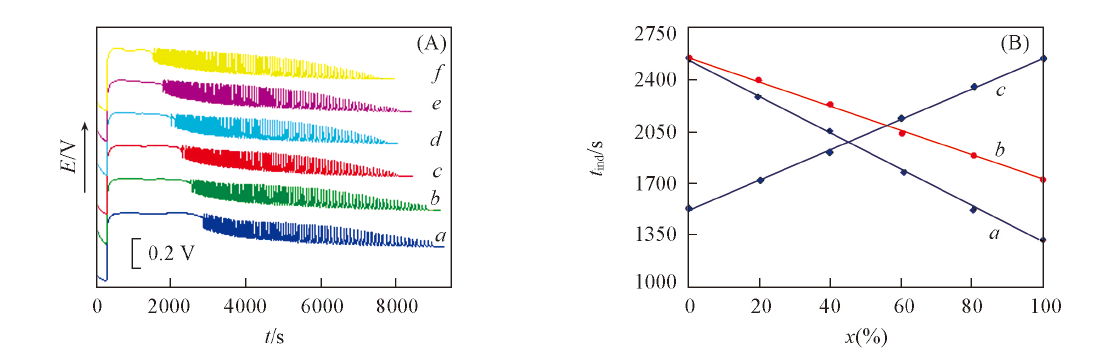
Fig.3 Influence of cow milk content in mixture consisting of cow and goat milks on characteristic information of non-linear chemical fingerprint(A) and relationships between inductive time and raw milk contents in mixed milks(B)(A) Content of cow milk, a—f: 0, 20%, 40%, 60%, 80%, 100%; (B) a. mixture of goot milk and cow milk; b. mixture of goat milk and mare milk; c. mixture of cow milk and mare milk(mass ratio 1∶1) with goat milk.
| Standard sample | 45 ℃ | 50 ℃ | |||
|---|---|---|---|---|---|
| Name | Constituent(%) | tind/s | y=Δtind/s | tind/s | y=Δtind/s |
| Goat milk | x3 = 100 | 3842 | 0 | 2549 | 0 |
| Mixed milk 1 | x1=18.0, x2=2.00, x3=80.0 | 3462 | -380 | 2331 | -218 |
| Mixed milk 2 | x1=27.0, x2=20.0, x3=53.0 | 3128 | -714 | 2164 | -385 |
| Mixed milk 3 | x1=41.0, x2=30.0, x3=29.0 | 2844 | -998 | 2003 | -546 |
Table 1 Standard samples for establishing analytical system model and their non-linear chemical fingerprint information determined at different temperatures*
| Standard sample | 45 ℃ | 50 ℃ | |||
|---|---|---|---|---|---|
| Name | Constituent(%) | tind/s | y=Δtind/s | tind/s | y=Δtind/s |
| Goat milk | x3 = 100 | 3842 | 0 | 2549 | 0 |
| Mixed milk 1 | x1=18.0, x2=2.00, x3=80.0 | 3462 | -380 | 2331 | -218 |
| Mixed milk 2 | x1=27.0, x2=20.0, x3=53.0 | 3128 | -714 | 2164 | -385 |
| Mixed milk 3 | x1=41.0, x2=30.0, x3=29.0 | 2844 | -998 | 2003 | -546 |
| Sample No. | y=-Δtind/s | x1 | x2 | x3 | Evaluation resultb | ||||||||||
|---|---|---|---|---|---|---|---|---|---|---|---|---|---|---|---|
| 45 ℃ | 50 ℃ | Measured value (%) | True value (%) | RSD (%) | Recovery (%) | Measured value (%) | True value (%) | RSD (%) | Recovery (%) | Measured value (%) | True value (%) | RSD (%) | Recovery (%) | ||
| 1 | 1991 | 1154 | 97.33 | 100.0 | 1.2 | 97.33 | 1.45 | 0.000 | 3.5 | 1.22 | 0.000 | 3.9 | Cow milk | ||
| 2 | 25.7 | 15.8 | 1.48 | 0.000 | 3.7 | -0.71 | 0.000 | 4.3 | 99.23 | 100.0 | 0.77 | 100.0 | Goat milk | ||
| 3 | 1822 | 1055 | 88.97 | 90.0 | 1.5 | 98.86 | 1.59 | 0.000 | 3.5 | 9.44 | 10.0 | 2.75 | 94.4 | G-C milk | |
| 4 | 495 | 187 | -1.03 | 0.000 | 4.0 | 82.11 | 80.0 | 1.6 | 102.6 | 19.52 | 20.0 | 1.9 | 97.6 | G-M milk | |
| 5 | 585 | 337 | 28.11 | 28.00 | 1.7 | 100.4 | 1.91 | 2.00 | 3.2 | 95.7 | 69.98 | 70.00 | 1.1 | 99.97 | G-C-M milk |
| 6 | 849 | 469 | 35.82 | 35.00 | 1.6 | 102.3 | 18.96 | 20.00 | 1.8 | 94.8 | 45.22 | 45.00 | 1.5 | 100.5 | G-C-M milk |
| 7 | 1401 | 776 | 59.40 | 60.00 | 1.3 | 99.0 | 30.40 | 30.00 | 1.5 | 101.3 | 10.2 | 10.00 | 2.7 | 102 | G-C-M milk |
| 8 | 825 | 381 | 15.82 | 15.00 | 2.1 | 105.5 | 79.97 | 81.00 | 1.0 | 98.73 | 4.21 | 4.00 | 3.5 | 105.3 | G-C-M milk |
| 9 | 1096 | 627 | 51.38 | 52.00 | 1.4 | 98.8 | 7.93 | 8.00 | 2.9 | 99.1 | 40.69 | 40.00 | 1.4 | 101.7 | G-C-M milk |
| 10 | 1338 | 760 | 61.60 | 60.00 | 1.2 | 102.7 | 13.25 | 13.00 | 2.4 | 101.9 | 25.15 | 27.00 | 1.6 | 93.2 | G-C-M milk |
Table 2 Raw milk contents of 10 dairy products obtained by non-linear chemical throng component analysis, comparison with their true values and the results of identification and evaluationa
| Sample No. | y=-Δtind/s | x1 | x2 | x3 | Evaluation resultb | ||||||||||
|---|---|---|---|---|---|---|---|---|---|---|---|---|---|---|---|
| 45 ℃ | 50 ℃ | Measured value (%) | True value (%) | RSD (%) | Recovery (%) | Measured value (%) | True value (%) | RSD (%) | Recovery (%) | Measured value (%) | True value (%) | RSD (%) | Recovery (%) | ||
| 1 | 1991 | 1154 | 97.33 | 100.0 | 1.2 | 97.33 | 1.45 | 0.000 | 3.5 | 1.22 | 0.000 | 3.9 | Cow milk | ||
| 2 | 25.7 | 15.8 | 1.48 | 0.000 | 3.7 | -0.71 | 0.000 | 4.3 | 99.23 | 100.0 | 0.77 | 100.0 | Goat milk | ||
| 3 | 1822 | 1055 | 88.97 | 90.0 | 1.5 | 98.86 | 1.59 | 0.000 | 3.5 | 9.44 | 10.0 | 2.75 | 94.4 | G-C milk | |
| 4 | 495 | 187 | -1.03 | 0.000 | 4.0 | 82.11 | 80.0 | 1.6 | 102.6 | 19.52 | 20.0 | 1.9 | 97.6 | G-M milk | |
| 5 | 585 | 337 | 28.11 | 28.00 | 1.7 | 100.4 | 1.91 | 2.00 | 3.2 | 95.7 | 69.98 | 70.00 | 1.1 | 99.97 | G-C-M milk |
| 6 | 849 | 469 | 35.82 | 35.00 | 1.6 | 102.3 | 18.96 | 20.00 | 1.8 | 94.8 | 45.22 | 45.00 | 1.5 | 100.5 | G-C-M milk |
| 7 | 1401 | 776 | 59.40 | 60.00 | 1.3 | 99.0 | 30.40 | 30.00 | 1.5 | 101.3 | 10.2 | 10.00 | 2.7 | 102 | G-C-M milk |
| 8 | 825 | 381 | 15.82 | 15.00 | 2.1 | 105.5 | 79.97 | 81.00 | 1.0 | 98.73 | 4.21 | 4.00 | 3.5 | 105.3 | G-C-M milk |
| 9 | 1096 | 627 | 51.38 | 52.00 | 1.4 | 98.8 | 7.93 | 8.00 | 2.9 | 99.1 | 40.69 | 40.00 | 1.4 | 101.7 | G-C-M milk |
| 10 | 1338 | 760 | 61.60 | 60.00 | 1.2 | 102.7 | 13.25 | 13.00 | 2.4 | 101.9 | 25.15 | 27.00 | 1.6 | 93.2 | G-C-M milk |
| Doped milk | t/℃ | x1(%) | x2(%) | x3(%) | R=-Δtind/s | S(s/100%) | S formula | N/s | D(%) | D formula |
|---|---|---|---|---|---|---|---|---|---|---|
| Cow milk | 50 | 50 | 0 | 50 | 621 | 1242 | S=R/x1 | 8 | 1.93 | D=3N/S |
| Mare milk | 50 | 0 | 50 | 50 | 427 | 854 | S=R/x2 | 8 | 2.81 | D=3N/S |
Table 3 Sensitivities and detection limits to determine contents of cow milk and mare milk doped in goat milk
| Doped milk | t/℃ | x1(%) | x2(%) | x3(%) | R=-Δtind/s | S(s/100%) | S formula | N/s | D(%) | D formula |
|---|---|---|---|---|---|---|---|---|---|---|
| Cow milk | 50 | 50 | 0 | 50 | 621 | 1242 | S=R/x1 | 8 | 1.93 | D=3N/S |
| Mare milk | 50 | 0 | 50 | 50 | 427 | 854 | S=R/x2 | 8 | 2.81 | D=3N/S |
| [1] | Tang H. M., Luo Y. M., Yan Y., Liang Q. L., Meng X. S., Luo G. A., Chem. J. Chinese Universities, 2009, 30(2), 279—282 |
| (汤宏敏, 罗永明, 鄢燕, 梁琼麟, 孟宪生, 罗国安.高等学校化学学报, 2009,30(2), 279—282) | |
| [2] | Bi Y. F., Liu S., Li X., Liu Z. Q., Song F. R., Chem. J. Chinese Universities, 2013, 34(9), 2084—2089 |
| (毕云枫, 刘舒, 李雪, 刘志强, 宋凤瑞.高等学校化学学报, 2013,34(9), 2084—2089) | |
| [3] | Li X. T., Zhao Y. J., Jiang C. F., Zhang H. Q., Yu A. M., Chem. Res. Chinese Universities, 2013, 29(3), 434—438 |
| [4] | Han J., Wu X., Cai W. S., Shao X. G., Chem. Res. Chinese Universities, 2014, 30(4), 578—581 |
| [5] | Zhang T. M., Liang Y. Z., Yuan B., Ding F., Zhang Y. P., Wei M. Q., Chen S., Chinese Science Bulletin, 2007, 52(16), 2190—2202 |
| [6] | Zhang T. M., Liang Y. Z., Yuan B., Ding F., Zhang Y. P., Chen W. Y., Chinese Science Bulletin, 2007, 52(20), 2753—2765 |
| [7] | Field R. T., Koros E., Noyes R. M., J. Am. Chem. Soc., 1972, 94(25), 8649—8664 |
| [8] | Taylor A. F., Chaos, 2002, 27(4), 247—325 |
| [9] | Prjman J. A., Epstein I. R., Mcmanus T. J., J. Phys. Chem., 1991, 95(3), 1299—1306 |
| [10] | Gan N. Q., Cai R. X., Lin Z. X., Anal. Chim. Acta, 2002, 464(2), 257—260 |
| [11] | Wang J., Yang S. T., Cai R. X., Talanta, 2005, 65(3), 799—805 |
| [12] | Fang X. Q., Zhang T. M., Zhao Z., Xiang F. Q., Liang Y. Z., Wang M., Zhu R., Cheng S., Ding F., Qiao J. X., Chinese Science Bulletin, 2010, 55(26), 2937—2944 |
| [13] | Zhang T. M., Zhao Z., Fang X. Q, Qiao J. X., Xiang F. Q., Zhu R., Liang Y. Z., Ding F., Science China Chemistry, 2012, 55, 285—303 |
| [14] | Zhang T. M., Zhao Z., Fang X. Q., Qiao J. X., Xiang F. Q., Zhu R., Liang Y. Z., Ding F., Science China Chemistry, 2012, 55, 304—322 |
| [15] | Zhang T.M., Mao P. F., Yang X. Y., Ding F.,China Instrumentation, 2010, (6), 60—62 |
| (张泰铭, 毛鹏飞, 阳小燕, 丁峰. 中国仪器仪表, 2010, (6), 60—62) | |
| [16] | Du B. Z., Qu M. J., Ma G. Y., Chinese Science Bulletin, 2012, 57(11), 68—73 |
| (杜宝中, 屈敏佳, 马国营.科学通报, 2012,57(11), 68—73) | |
| [17] | Cheng W. X., Chen J., Fang C. W., Wu D. L., Chinese Chemical Letters, 2011, 22(6), 729—732 |
| [18] | Zhang J., Zhong J. H., Wang Z. P., Luo X. L., Fu T. F., Zhang T. M., Wang Y. N., Guo S. S., Wang E. D., Chinese J. Anal. Chem., 2014, 42(4), 559—564 |
| (张娟, 钟俊辉, 王志沛, 骆学雷, 付廷发, 张泰铭, 王艳娜, 郭沙沙, 王二丹.分析化学, 2014,42(4), 559—564) | |
| [19] | Li S. J., Huang J. B., Zou G. H., Lan H., Luo S. X., Yu L., Zong X. M., Wang X., Chinese J. Anal. Chem.,2010,38(9), 1353—1356) |
| ( 李守君, 黄金宝, 邹桂华, 兰焕, 罗时旋, 于莲, 宗希明, 王旭.分析化学, 2010,38(9), 1353—1356) | |
| [20] | Yang D. M., Fang X. Q., Feng M., Tang X. L., Mao P. F., Zhang T. M., Food and Machinery, 2012, 28(1), 86—92 |
| (杨代明, 方宣启, 冯敏, 唐小兰, 毛鹏飞, 张泰铭.食品和机械, 2012,28(1), 86—92) | |
| [21] | Zhang H. Z., Xiao C. L., Yang X. H., Tang A. D., Food Research and Development, 2012, 33(4), 194—197 |
| (张海珍, 肖长龙, 杨学华, 唐爱东.食品研究与开发, 2012,33(4), 194—197) | |
| [22] | Sun Y. H., Feng J., Wu L. S., Science and Technology of Food Industry, 2010, 31(6), 91—93 |
| (孙艳辉, 冯娟, 吴霖生.食品工业科技, 2010,31(6), 91—93) | |
| [23] | Qiao J. X., Lu L. L., Zhang T. M., Zhao Z., Xiang F. Q., Zhu R., Wang Y. N., Guo S. S., Zhang J., J. Appl. Biochem., 2013, 106, 145—156 |
| [24] | Xiang F. Q., Fang X. Q., Zhang T. M., Mao P. F., Qiao J. X., Zhu R., Zhao Z., Wang Y. N., Guo S. S., J. Chem. Science, 2013, 107, 209—222 |
| [25] | Zhang J., Qiao J. X., Zhang T. M., Mao P. F., Zhao Z., Xiang F. Q., Fang X. Q., Zhu R., Wang Y. N., Guo S. S., J. Food Technology, 2014, 106, 189—200 |
| [26] | Lu L. L., Dong W. B., Zhang T. M., Zhang J., Wang E. D., Xu T. S., Food and Fermentation Industry, 2014,40(3), 78—82) |
| (鲁利利, 董文宾, 张泰铭, 张娟, 王二丹, 许天舒.食品与发酵工业, 2014,40(3), 78—82) |
| [1] | HUANG Jialing,LIU Fengjiao,WANG Tingting,LIU Cuie,ZHENG Fengying,WANG Zhenhong,LI Shunxing. Nitrogen and Sulfur co-Doped Carbon Quantum Dots for Accurate Detection of pH in Gastric Juice† [J]. Chem. J. Chinese Universities, 2020, 41(7): 1513. |
| [2] | XIA Jiaoyun,XU Tong,QING Jing,XIONG Yan,LIU Junjie,GONG Fuchun. Highly Sensitive Sensor for Lead Ion Based on Thioflavin T-induced G-quadruplex Formation † [J]. Chem. J. Chinese Universities, 2020, 41(5): 1004. |
| [3] | WU Zhidong,YOU Jinglin,WANG Jian,WANG Min,HE Yingxia,YANG Yejin. NMR Spectroscopic Study on Binary Sodium Silicate Glass Based on the Fine Structure† [J]. Chem. J. Chinese Universities, 2019, 40(1): 108. |
| [4] | SUN Mengmeng,CHANG Chunrui,ZHANG Zhiming,AN Libao. Preparation and Electrical Contact Properties of Palladium-doped Multi-walled Carbon Nanotubes† [J]. Chem. J. Chinese Universities, 2019, 40(1): 11. |
| [5] | LIAN Xiang, WU Wanghua, FAN Hongliang, ZHANG Yong, ZHANG Tao. Dual Enzyme Cleavage-based Cascade Signal Amplification for Nucleic Acids Detection† [J]. Chem. J. Chinese Universities, 2018, 39(7): 1427. |
| [6] | TAN Xueying, ZHANG Taiming, DENG Feiyue, HUANG Jian, WEN Qing, CHEN Chunnan. Identification of Different Acorus calamus and Determination of Content of Acorus calamus in Binary Mixtures by Nonlinear Chemical Fingerprint† [J]. Chem. J. Chinese Universities, 2018, 39(7): 1440. |
| [7] | YUAN Haojun, GAO Wanlei, JING Fengxiang, LIU Songsheng, ZHOU Hongbo, JIA Chunping, JIN Qinghui, ZHAO Jianlong. Novel Microfluidic Droplet Digital PCR Chip for High Sensitive Detection of Nucleic Acid† [J]. Chem. J. Chinese Universities, 2017, 38(7): 1140. |
| [8] | WEI Lanlan, YAN Yan, KANG Xuejue. Application of Packed-nanofibers Solid-phase Extraction for Determination of Rhodamine B in Dry Chilli, Fruit Drink and Red Wine [J]. Chem. J. Chinese Universities, 2017, 38(6): 935. |
| [9] | WANG Ziyue, LIU Meng, ZHANG Chunyang. Advance in Ultrasensitive Detection of MicroRNA† [J]. Chem. J. Chinese Universities, 2017, 38(1): 1. |
| [10] | CHEN Long, LI Yan, WANG Zhenwen, PENG Zhiyong, YANG Zeming, YUAN Lihua, FENG Wen. High Efficiency and Selective Extraction of Uranyl Ion by N,N'-Diethyl-N,N'-bis(propoxyphenyl)-2,6-dipicolinamide† [J]. Chem. J. Chinese Universities, 2015, 36(8): 1485. |
| [11] | HUANG Chibao, LIANG Xing, ZENG Qihua, CHEN Huashi, ZENG Boping, YI Daosheng, CHEN Xiaoyuan. Dicyanostilbene-derived Two-photon Fluorescence Probe for Free Zinc Ions in Live Cells and Living Tissues† [J]. Chem. J. Chinese Universities, 2015, 36(4): 646. |
| [12] | TANG Ji-Jun, XU Hua, CHEN Jia, GUO Lei, XIE Jian-Wei. Establishment and Application of a Magnetic Separation-based Aptameric Real-time Quantitative PCR Detection Approach [J]. Chem. J. Chinese Universities, 2013, 34(5): 1115. |
| [13] | NING Yu, CAI Wen-Sheng, SHAO Xue-Guang. Simultaneous Determination of Mercury(Ⅱ) and Silver(Ⅰ) Ions in Water by Near-Infrared Spectroscopy with Preconcentration by Thiol-functionalized Polysilsesquioxane Microspheres [J]. Chem. J. Chinese Universities, 2012, 33(04): 673. |
| [14] | HAO Yong, CAI Wen-Sheng, SHAO Xue-Guang*. Construction of the Calibration Model for Near-infrared Spectral Analysis of Complex Samples [J]. Chem. J. Chinese Universities, 2009, 30(1): 28. |
| [15] | MO Zhi-Hong*, HUANG Hong-Ji, QIAN Jun-Zhen, ZHU Li-Hua. Piezoelectric Immunosensor Detection of IgG Based on Nanoprobe Immunoagglutination [J]. Chem. J. Chinese Universities, 2007, 28(4): 649. |
| Viewed | ||||||
|
Full text |
|
|||||
|
Abstract |
|
|||||