Synthesis, N2 Adsorption and Mixed-matrix Membrane Performance of Bimetal Isostructural CAU-21
ZHANG Chi1, SUN Fuxing2(), ZHU Guangshan1()
1.Key Laboratory of Polyoxometalate and Reticular Material Chemistry of Ministry of Education,Faculty of Chemistry,Northeast Normal University,Changchun 130024,China 2.State Key Laboratory of Inorganic Synthesis & Preparative Chemistry,Jilin University,Changchun 130012,China
ZHANG Chi, SUN Fuxing, ZHU Guangshan. Synthesis, N2 Adsorption and Mixed-matrix Membrane Performance of Bimetal Isostructural CAU-21[J]. Chem. J. Chinese Universities, 2022, 43(1): 20210578.
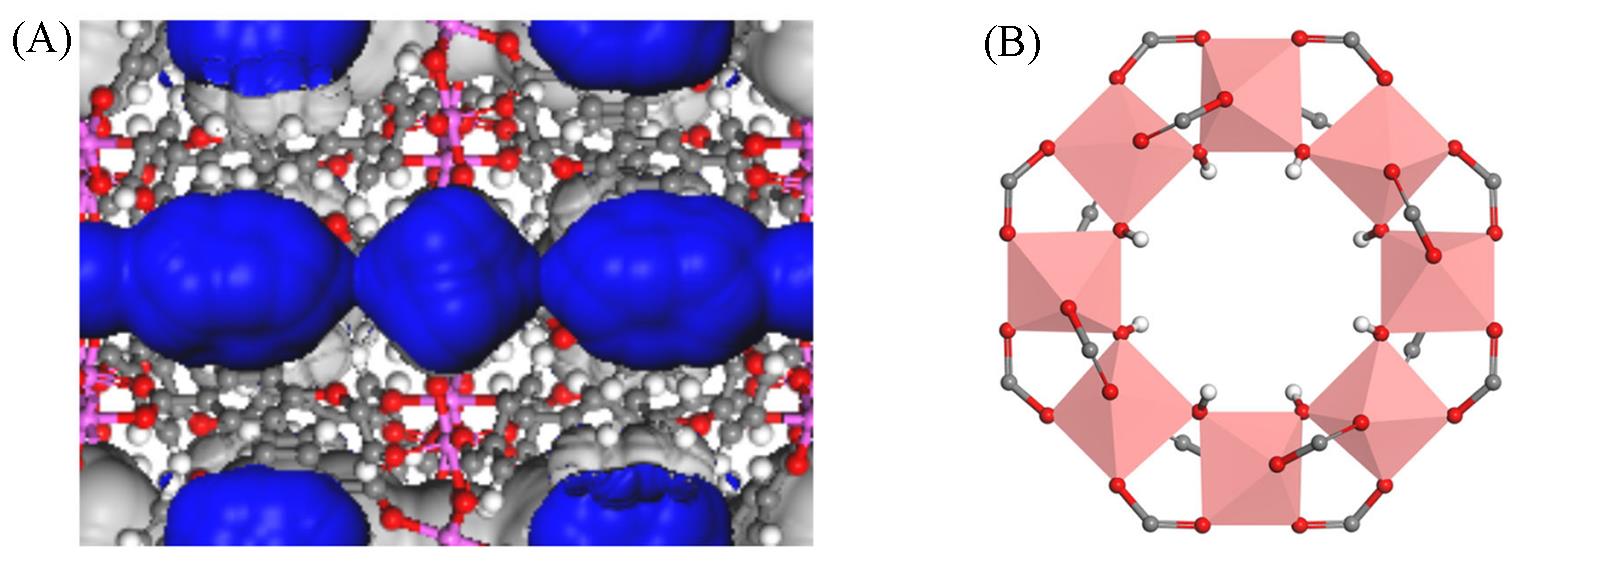
Fig.1 Structure schematic of CAU?21(A) and the window of the pore in the CAU?21 structure composed of eight metal oxygen clusters(B)The blue part is shown as one?dimensional channel
Fig.1 Structure schematic of CAU?21(A) and the window of the pore in the CAU?21 structure composed of eight metal oxygen clusters(B)The blue part is shown as one?dimensional channel
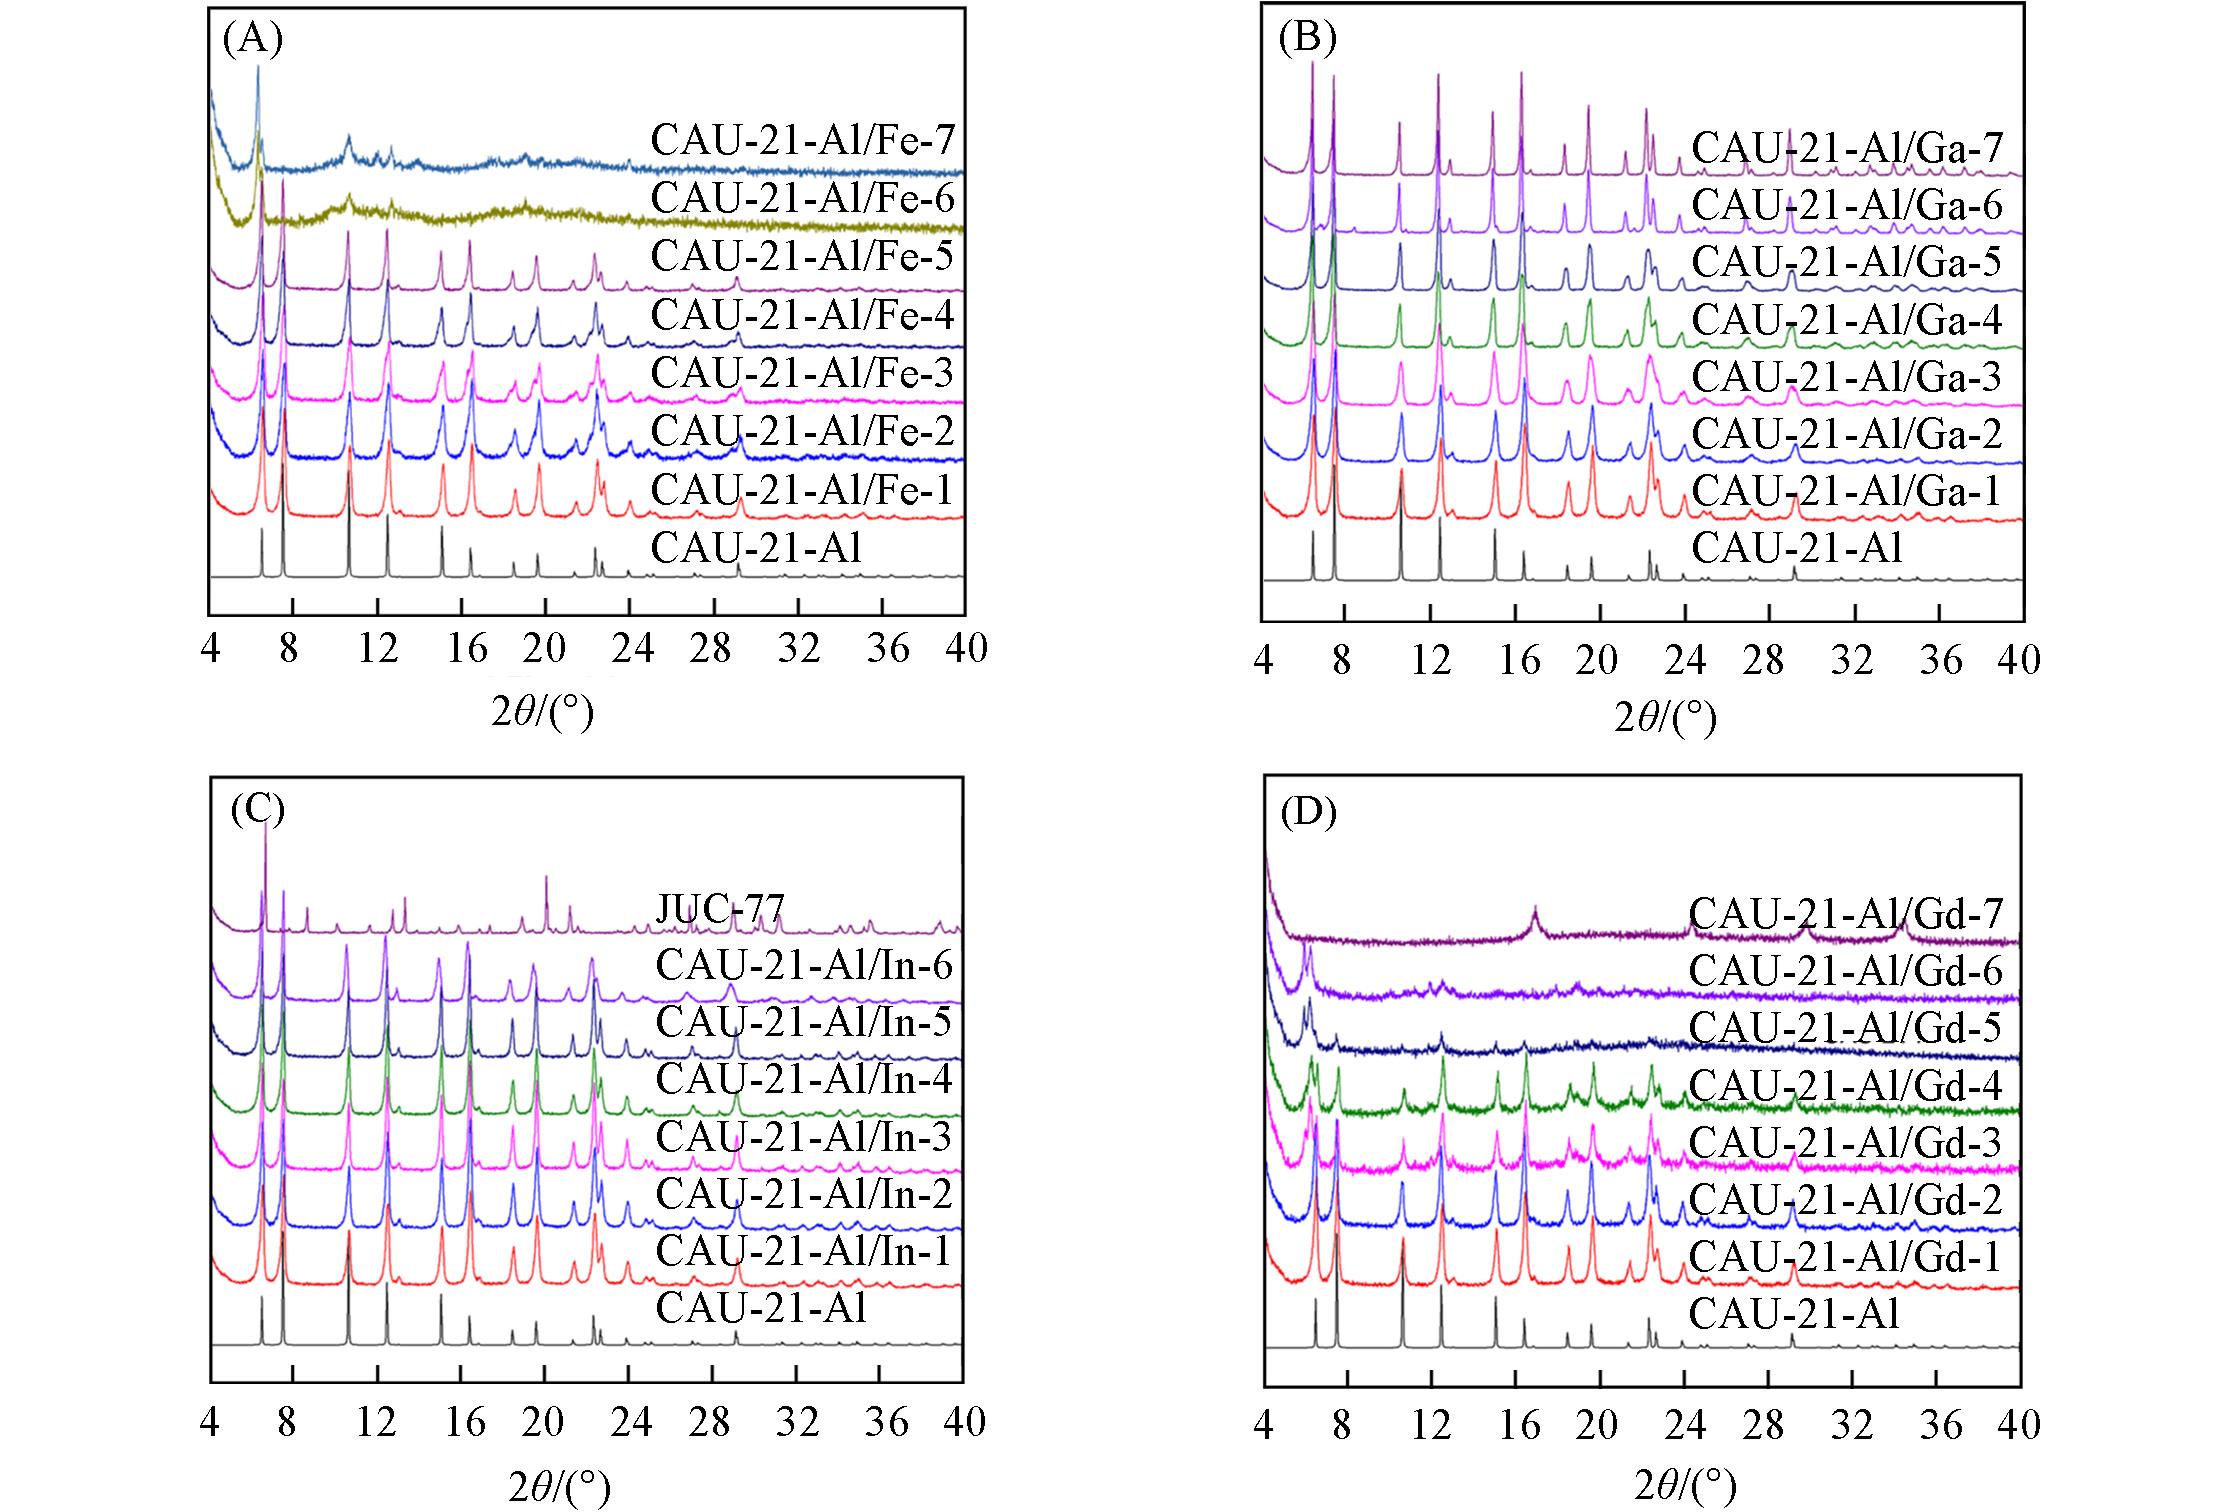
Fig.2 XRD pattens of products obtained from experiments with different metals and different doping amounts
Fig.2 XRD pattens of products obtained from experiments with different metals and different doping amounts
Table 1 Comparison of the metal contents in the materials measured by EDX and the feed ratio
Table 1 Comparison of the metal contents in the materials measured by EDX and the feed ratio
MOF code
Molar ratio of Al/M
EDX
Feed ratio
CAU?21?Al/Fe?5
72∶28
30∶70
CAU?21?Al/In?6
75∶25
10∶90
CAU?21?Al/Gd?4
94∶6
40∶60
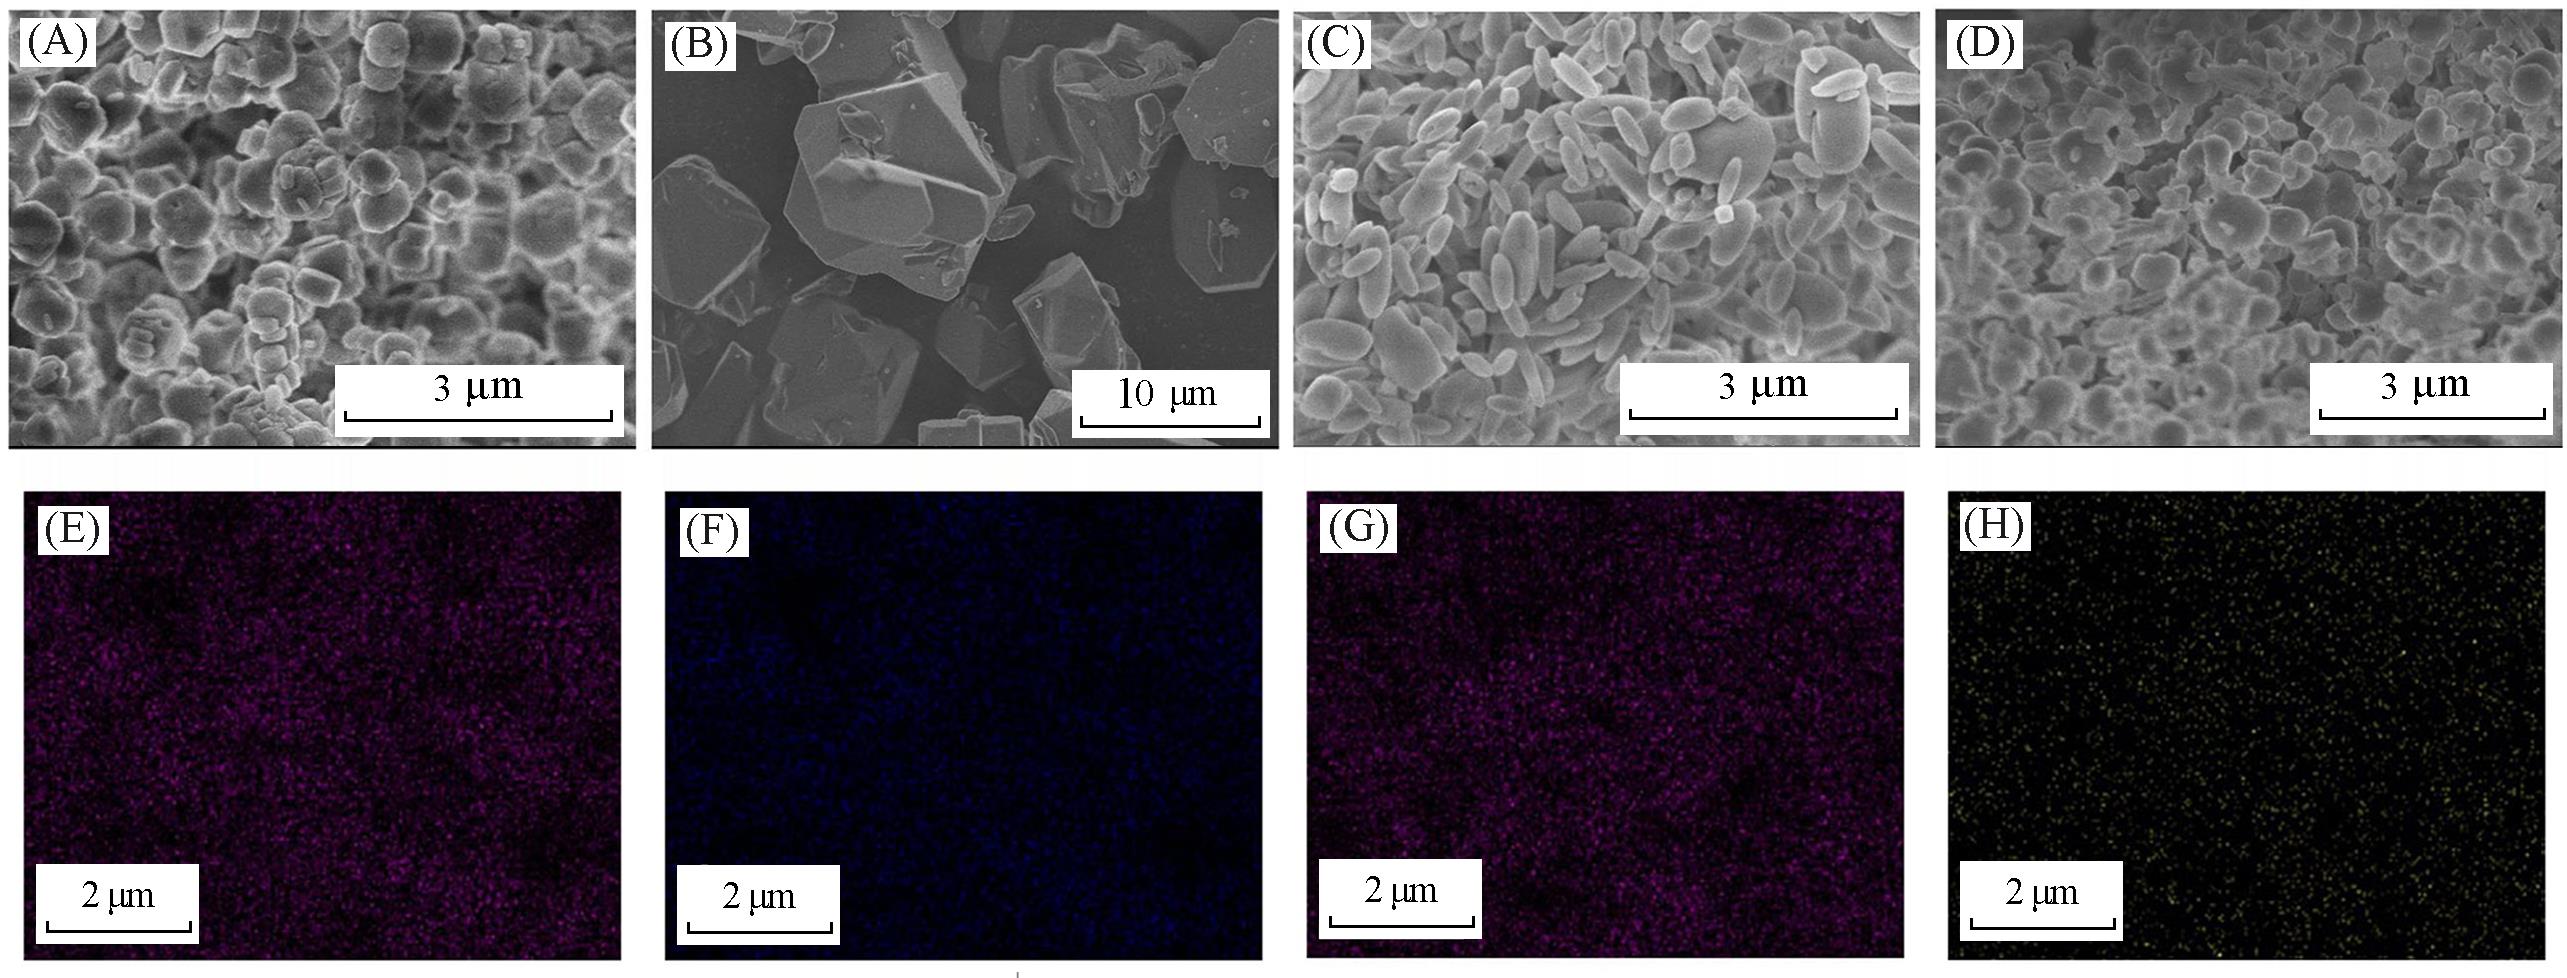
Fig.3 SEM(A—D) and EDS element mapping(E—H) images of CAU?21?Al/M with the metal Fe, Ga, In, and Gd reaching the maximum doping amountsThe purple in the EDS mapping result shows the distribution of Al, blue shows the distribution of In, and yellow shows the distribution of Gd.
Fig.3 SEM(A—D) and EDS element mapping(E—H) images of CAU?21?Al/M with the metal Fe, Ga, In, and Gd reaching the maximum doping amountsThe purple in the EDS mapping result shows the distribution of Al, blue shows the distribution of In, and yellow shows the distribution of Gd.
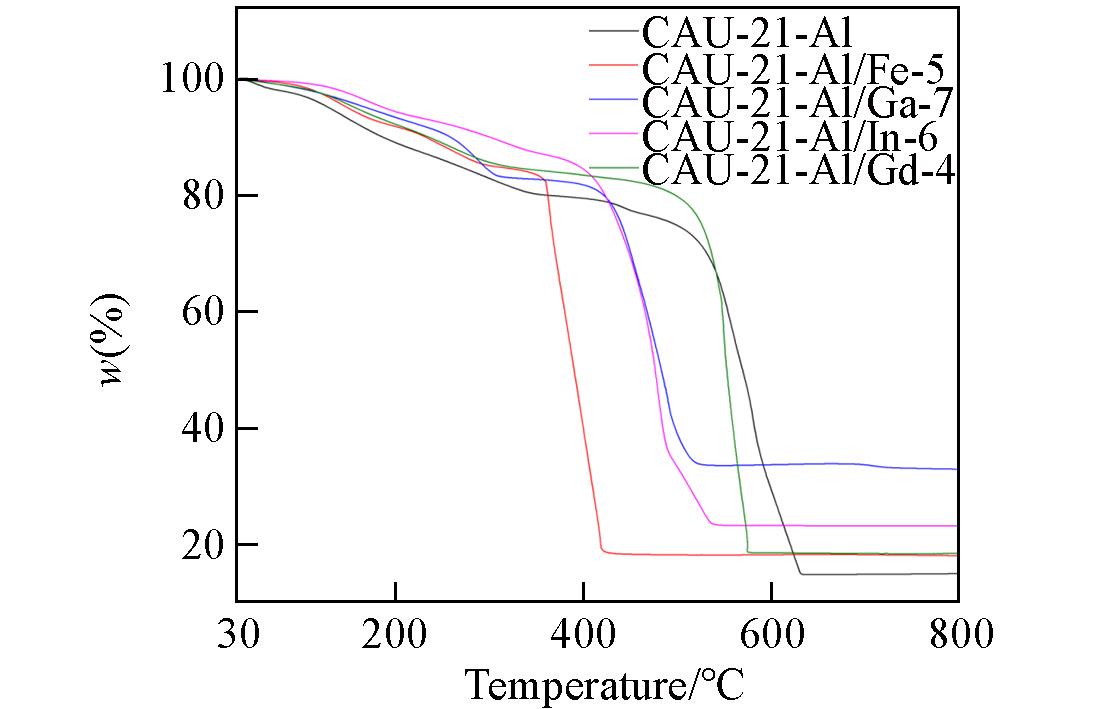
Fig.4 TGA results of materials with different dopingmetals reaching the maximum doping amounts
Fig.4 TGA results of materials with different dopingmetals reaching the maximum doping amounts
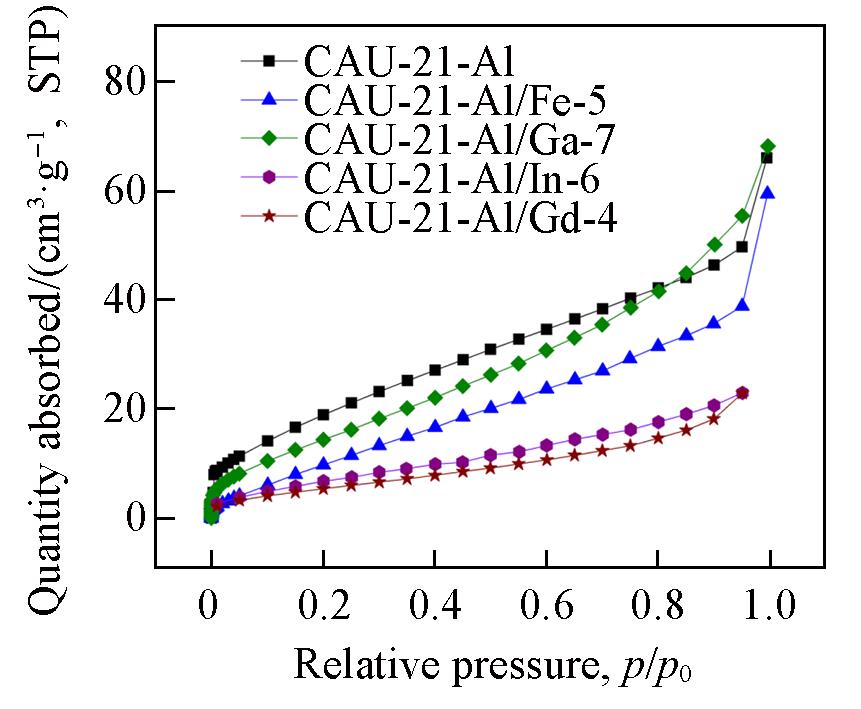
Fig.5 N2 adsorption test results of CAU?21 materials with different doping metals reaching the maximum doping amounts
Fig.5 N2 adsorption test results of CAU?21 materials with different doping metals reaching the maximum doping amounts
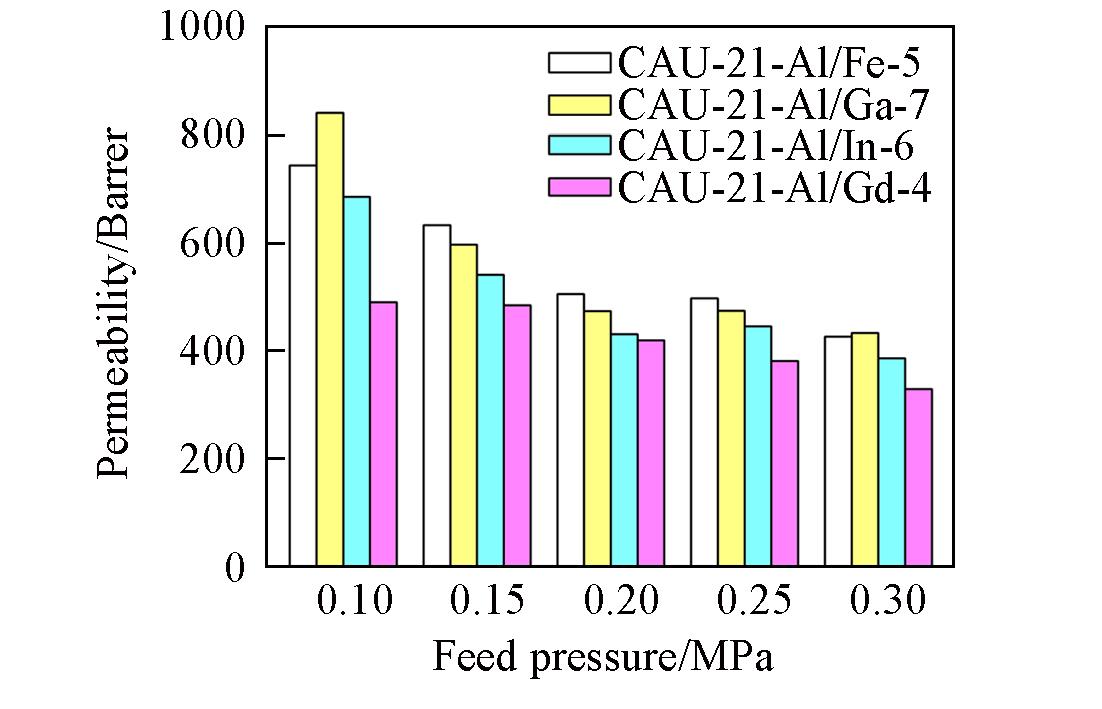
Fig.6 Histograms of nitrogen permeability of mixed?matrix membranes using PIM?1 as the matrix with 15%(mass fraction) filler under different feed pressures
Fig.6 Histograms of nitrogen permeability of mixed?matrix membranes using PIM?1 as the matrix with 15%(mass fraction) filler under different feed pressures
 ), ZHU Guangshan1(