Toggle navigation
CJCU
Home
About Journal
Editorial Board
Editorial Board
Youth Executive Editorial Board
Editorial Introduction
Guide for Author
Journal
Forthcoming Articles
Asap
Current Issue
Archive
Most Download Articles
Most Read Articles
Most Cited Articles
Email Alert
RSS
Subscription
Contact Us
中文
Image/Table Caption
Advanced options
Journals
Article DOI
ALL
Chem. J. Chinese Universities
Publication Year From
Publication Year To
FromYear
1980
1981
1982
1983
1984
1985
1986
1987
1988
1989
1990
1991
1992
1993
1994
1995
1996
1997
1998
1999
2000
2001
2002
2003
2004
2005
2006
2007
2008
2009
2010
2011
2012
2013
2014
2015
2016
2017
2018
2019
2020
2021
2022
2023
2024
2025
2026
ToYear
2026
2025
2024
2023
2022
2021
2020
2019
2018
2017
2016
2015
2014
2013
2012
2011
2010
2009
2008
2007
2006
2005
2004
2003
2002
2001
2000
1999
1998
1997
1996
1995
1994
1993
1992
1991
1990
1989
1988
1987
1986
1985
1984
1983
1982
1981
1980
Volume
Issue
Author
Institution
Journals
Publication Years
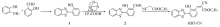
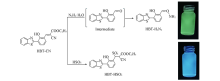
Scheme 1 Synthesis of the probe HBT-CN
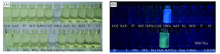
Fig.1 Photographs of color change(A) and fluorescence response(B) of HBT-CN(5.0×10
-6
mol/L) after adding HS
O
3
-
(2.5×10
-4
mol/L), N
2
H
4
·H
2
O(1×10
-3
mol/L) and other analytes(2.5×10
-3
mol/L)
V
(DMSO):
V
(PBS)=1:4.
Table 1 Amino acid sequences of synthetic polypeptides
Table 2 Real-time PCR primer
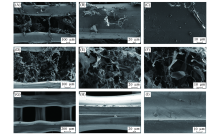
Fig.1 SEM images of PLGA/COL scaffolds(A—C), interpore structure of the PLGA/COL scaffolds(D—F) and pure PLGA scaffold(G—I)
Fig.2 Water droplets and contact angles on the surface of different scaffolds(A) PLGA; (B) PLGA/COL; (C) BMP2-MP@PLGA/COL; (D) CBD-BMP2-MP@PLGA/COL.
P
<0.05,
n
=4.
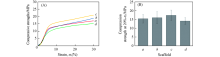
Fig.3 Mechanical properties of the PLGA(
a
), PLGA/COL(
b
), BMP2-MP@PLGA/COL(
c
) and CBD-BMP2-MP@PLGA/COL(
d
) tested at room temperature (A) Typical stress-strain curves; (B) compressive strength.
n
=3,
P
<0.05.
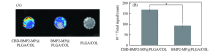
Fig.4 Collagen-binding ability of BMP2-MP and CBD-BMP2-MP detected by immunofluorescence (A) Immunofluorescence image; (B) total signal.
E
x
=488 nm,
E
m
=546 nm, error bars represent standard deviation for
n
=3, *
P
<0.05.
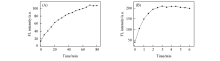
Fig.2 Time-dependent fluorescence intensity changes of HBT-CN(5×10
-6
mol/L) in the presence of N
2
H
4
·H
2
O(1×10
-3
mol/L,
λ
ex
=399 nm,
λ
em
=500 nm, slits: 2.5 nm/5 nm)(A) and HS
O
3
-
(1×10
-3
mol/L,
λ
ex
=399 nm,
λ
em
=458 nm, slits: 2.5 nm/5 nm)(B)
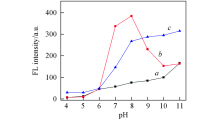
Fig.3 Fluorescence intensity of HBT-CN(5×10
-6
mol/L) changes with different pH values
a
. HBT-CN;
b
. HBT-CN+HS
O
3
-
;
c
. HBT-CN+N
2
H
4
·H
2
O.
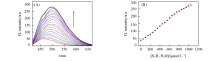
Fig.4 Fluorescence intensity of HBT-CN(5×10
-6
mol/L) changes upon gradual addition of N
2
H
4
·H
2
O(0—1.2×10
-3
mol/L)(A) and linear relationship between fluorescence intensity(500 nm) of HBT-CN and concentrations of N
2
H
4
·H
2
O(0—1.05×10
-3
mol/L)[
V
(DMSO):
V
(PBS)=1:4;
λ
ex
=399 nm, slit: 5 nm/5 nm](B)
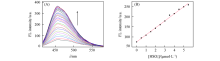
Fig.5 Fluorescence intensity of HBT-CN(5 μmol/L) changes upon gradual addition of HS
O
3
-
(0—3×10
-4
mol/L)(A) and linear relationship between fluorescence intensity of HBT-CN and concentrations of HS
O
3
-
(0—1.2×10
-4
mol/L) at 458 nm[
V
(DMSO):
V
(PBS)=1:4,
λ
ex
=399 nm, slit: 5 nm/5 nm](B)
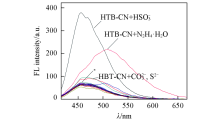
Fig.6 Fluorescence spectra of HBT-CN(5.0×10
-6
mol/L) in the presence of HS
O
3
-
, N
2
H
4
·H
2
O and other analytes
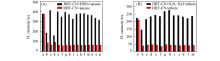
Fig.7 Fluorescence response of HBT-CN(5×10
-6
mol/L) in the presence of HS
O
3
-
+anions(A) and N
2
H
4
·H
2
O+others(B)Black bars represent the fluorescent intensity(458 nm) of HBT-CN(5×10
-6
mol/L) in the presence of anions after adding HS
O
3
-
; red bars represent the fluorescent intensity(458 nm) of HBT-CN(5×10
-6
mol/L) in the presence of anions in the absence of HS
O
3
-
. (A) a. HS
O
3
-
; b. C
O
3
2
-
; c. S
2
O
3
2
-
; d. S
2-
; e. S
O
4
2
-
; f. H
2
P
O
4
-
; g. C
2
O
4
2
-
; h. AcO
-
; i.
N
3
-
; j. SCN
-
; k. F
-
; l. Cl
-
; m. Br
-
; n. I
-
; o. N
O
3
-
; p. N
O
2
-
. (B) a. N
2
H
4
·H
2
O; b.GSH; c. Cys; d. Hcy; e. H
2
NCONH
2
; f. C
6
H
8
N
2
; g. NH(CH
3
)
2
; h. CH
3
CH
2
NH
2
; i. K
+
; j. Na
+
; k. N
H
4
+
; l. Mg
2+
; m. Ba
2+
.
Scheme 2 Proposed sensing mechanism of HBT-CN for N
2
H
4
·H
2
O and HS
O
3
-
Fig.1 Structure of HEtHex(TFS)
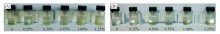
Fig.2 Stability of oil samples with different mass fractions of HEtHex(TFS) at 25 ℃(A) Ultrasound dispersion just ended; (B) ultrasound dispersion ended after 48 h.
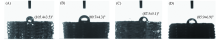
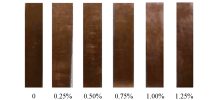
Fig.3 Corrosive photos of oil samples with different mass fractions of HEtHex(TFS) at 25 ℃
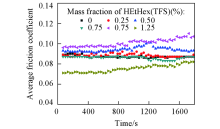
Fig.4 Friction coefficient diagram of six kinds of oil samples at 25 ℃
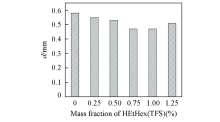
Fig.5 Wear scar diameters of six kinds of oil samples at 25 ℃
page
Page 1 of 1056
Total 21103 records
First page
Prev page
Next page
Last page