

Chem. J. Chinese Universities ›› 2020, Vol. 41 ›› Issue (3): 431.doi: 10.7503/cjcu20190615
• Articles • Previous Articles Next Articles
HE Yu1,XIA Qian1,WANG Wenli1,LUO Fang2,CHEN Jinfeng3,GUO Yating1,WANG Jian1,LIN Zhenyu1,*,CHEN Guonan1,*
Received:2019-11-27
Online:2020-03-10
Published:2020-01-07
Contact:
Zhenyu LIN,Guonan CHEN
Supported by:CLC Number:
TrendMD:
HE Yu, XIA Qian, WANG Wenli, LUO Fang, CHEN Jinfeng, GUO Yating, WANG Jian, LIN Zhenyu, CHEN Guonan. Triglycerides as Potential Biomarkers for Pesticides Pollution in Aquatic Environment Using UPLC-QTOF-MS †[J]. Chem. J. Chinese Universities, 2020, 41(3): 431.
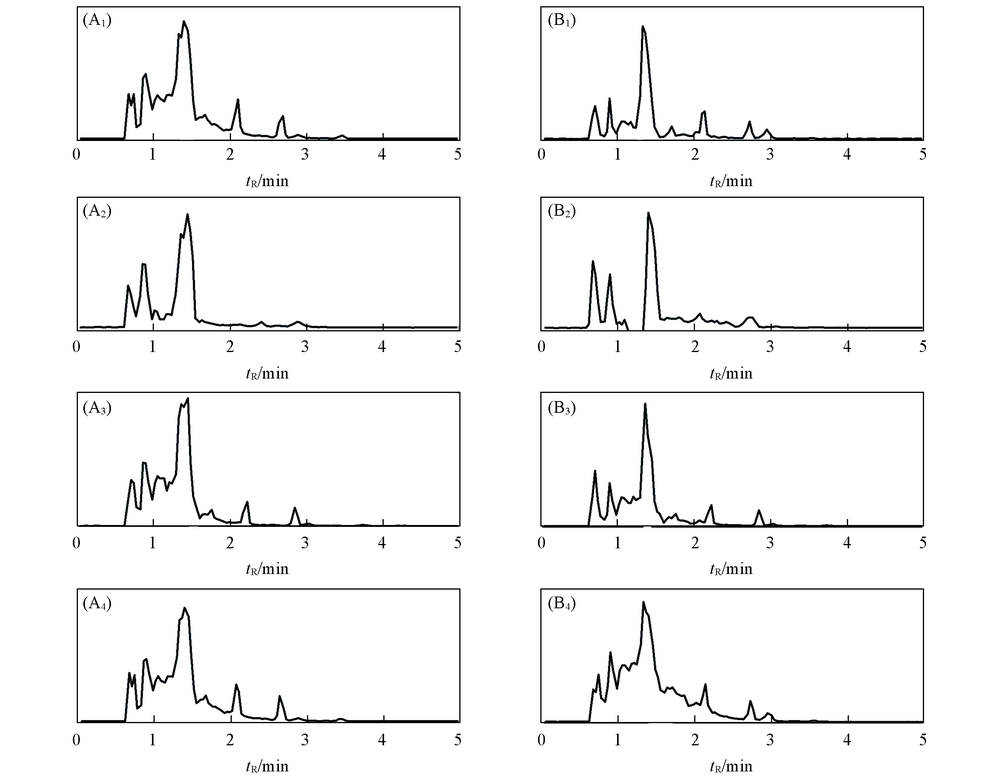
Fig.1 Total ion chromatograms(TIC) of brain(A) and liver tissues(B) (A1, B1) Blank; (A2, B2) exposure in trichlorfon; (A3, B3) exposure in β-cypermethrin; (A4, B4) exposure in imidacloprid.
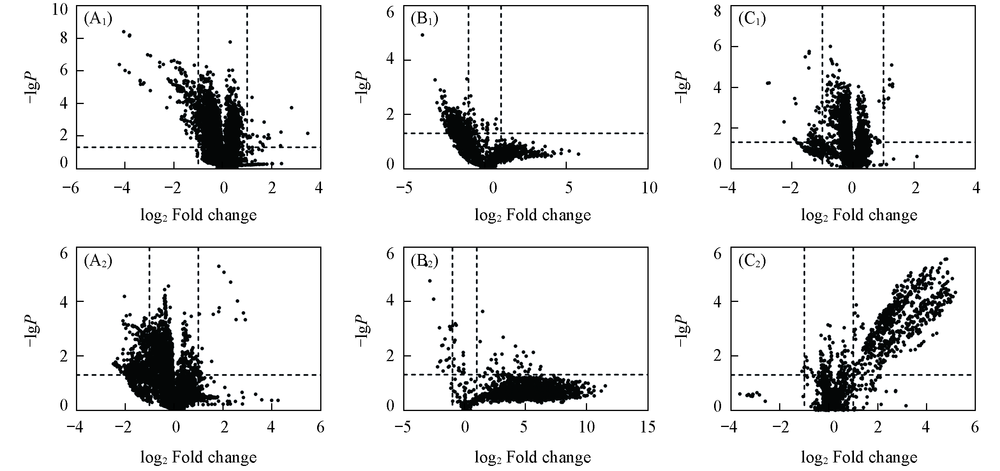
Fig.2 Volcano plots of endogenous metabolites(n=12, *P<0.05) (A1) Trichlorfon-treated brain; (A2) trichlorfon-treated liver; (B1) β-cypermethrin-treated brain; (B2) β-cypermethrin-treated liver; (C1) imidacloprid-treated brain; (C2) imidacloprid-treated liver.
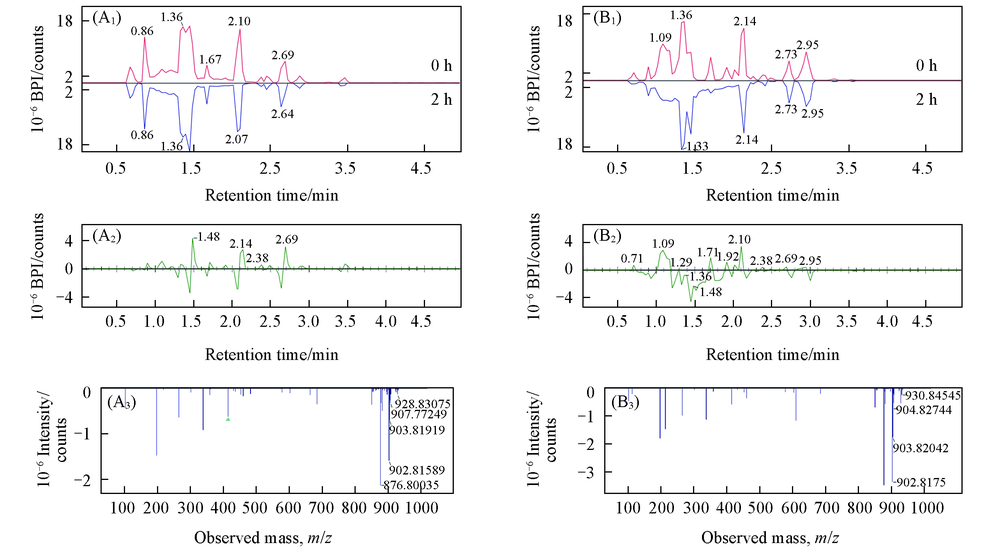
Fig.3 Binary contrast spectra of brain(A) and liver(B) tissues (A1) Base peak intensity(BPI) of brain exposed for 0 and 2 h; (A2) chromatogram of difference in brain; (A3) mass spectrum of difference in brain; (B1) BPI of liver exposed for 0 and 2 h; (B2) chromatogram of difference in liver; (B3) mass spectrum of difference in liver.
| Sample | Component, m/z | Unknown intensity/ counts | Reference intensity/ counts | Unknown/ reference | Observed retention time/min |
|---|---|---|---|---|---|
| In brain | 806.5728 | 3092718 | 3191399 | 0.9691 | 1.37 |
| 896.7709 | 2516408 | 2318847 | 1.0852 | 1.24 | |
| 870.7539 | 1748903 | 1984113 | 0.8815 | 1.23 | |
| 898.7881 | 1546268 | 1502813 | 1.0289 | 1.54 | |
| 832.5871 | 1376215 | 1468047 | 0.9374 | 1.33 | |
| 872.7726 | 1266039 | 1342851 | 0.9428 | 1.54 | |
| In liver | 896.7709 | 4236852 | 287846 | 14.7192 | 1.22 |
| 898.7881 | 3388133 | 181398 | 18.6779 | 1.52 | |
| 872.7726 | 2467030 | 158469 | 15.5679 | 1.52 | |
| 900.8013 | 2209446 | 227011 | 9.7328 | 1.79 | |
| 874.7853 | 2057944 | 266732 | 7.7153 | 1.79 | |
| 806.5728 | 3340418 | 3378909 | 0.9886 | 1.37 | |
| 832.5871 | 2278588 | 2178444 | 1.046 | 1.33 | |
| 146.1175 | 119687 | 124507 | 1.056 | 2.99 |
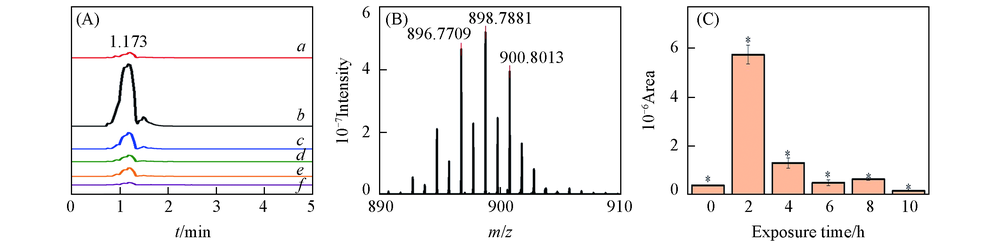
Fig.4 Effect of exposure time on endogenous metabolite(m/z 896.7709) (A) BPI of endogenous metabolite(m/z 896.7709). Exposure time/h: a. 0; b. 2; c. 4; d. 6; e. 8; f. 10; (B) mass spectrum of endogenous metabolite(m/z 896.7709); (C) effect of exposure time on peak area of endogenous metabolite(m/z 896.7709)(n=12, *P<0.05).
| Experimental accurate m/z | Theoretical m/z | 106δ | Chemical formula | Lipid name | Ion |
|---|---|---|---|---|---|
| 806.5728 | 806.5694 | 4 | C46H80NO8P | PC(38:6) | [M+H]+ |
| 832.5871 | 832.5851 | 2 | C48H82NO8P | PC(40:7) | [M+H]+ |
| 872.7726 | 872.7702 | 3 | C55H98O6 | TG(52:4) | [M+NH4]+ |
| 874.7867 | 874.7858 | 1 | C55H100O6 | TG(52:3) | [M+NH4]+ |
| 896.7709 | 896.7702 | 1 | C57H98O6 | TG(54:6) | [M+NH4]+ |
| 898.7881 | 898.7858 | 3 | C57H100O6 | TG(54:5) | [M+NH4]+ |
| 900.8013 | 900.8015 | 0 | C57H102O6 | TG(54:4) | [M+NH4]+ |
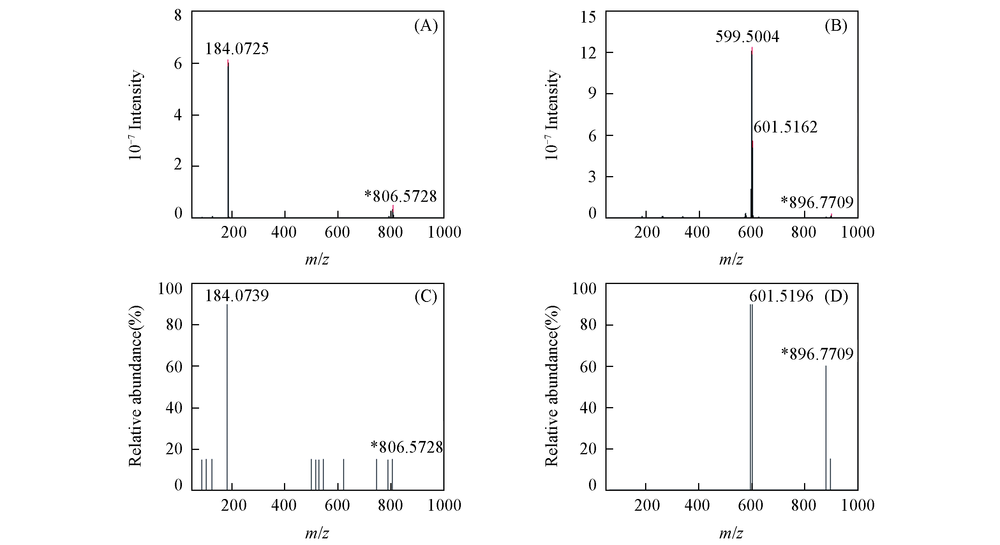
Fig.5 Comparison in detected MS/MS spectra and predicted MS/MS spectra in HMDB (A) Detected MS/MS spectrum of m/z 806.5728; (B) detected MS/MS spectrum of m/z 896.7709; (C) predicted MS/MS spectrum of m/z 806.5728; (D) predicted MS/MS spectrum of m/z 896.7709.
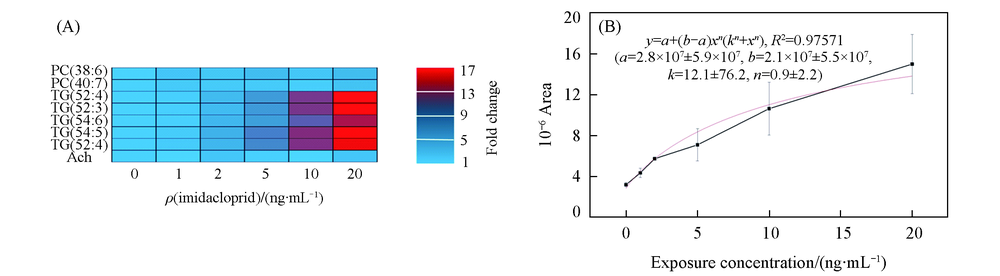
Fig.6 Effect of exposure concentration(n=12, *P<0.05) (A) Heatmap of the metabolites in fish liver exposed to different concentrations(0, 1, 2, 5, 10, 20 ng/mL) of imidacloprid for 2 h. Each concentration is represented in columns, and each metabolites in lines. Blue indicates low content, whereas red indicates high content; (B) Michaelis Menten equation fitting curve of m/z 896.7709 change with exposure concentration.
| [1] | Mahai G. G., Wan Y. J., Xia W., Yang S. Y., He Z. Y., Xu S. Q ., Chemosphere, 2019, 229, 452— 460 |
| [2] | Yuan X., Pan Z., Jin C., Ni Y., Fu Z., Jin Y ., Chemosphere, 2019, 227, 425— 434 |
| [3] | Wan Y., Wang Y., Xia W., He Z., Xu S ., Science of the Total Environment, 2019, 675, 513— 519 |
| [4] | Miao S. S., Wu M. S., Ma L. Y., He X. J., Yang H ., Talanta, 2016, 158, 142— 151 |
| [5] | Li Z., Qu S., Cui L., Zhang S ., Journal of Coastal Research, 2017, 1— 5 |
| [6] | Wu Y. Y., Jin D., Fu C. Y., Qi Z. J ., Agrochemicals, 2017, 56( 7), 510— 514 |
| ( 吴元元, 金朵, 付骋宇, 祁志军 . 农药, 2017, 56( 7), 510— 514) | |
| [7] | Sole M., Sanchez-Hernandez J. C ., Ecological Indicators, 2018, 85, 432— 439 |
| [8] | Ortiz-Villanueva E., Jaumot J., Martinez R., Navarro-Martin L., Pina B., Tauler R ., Science of the Total Environment, 2018, 635, 156— 166 |
| [9] | Jafarabadi A. R., Bakhtiari A. R., Maisano M., Pereira P., Cappello T ., Science of the Total Environment, 2018, 640, 1500— 1511 |
| [10] | Li M. H., Wang J. S., Lu Z. G., Wei D. D., Yang M. H., Kong L. Y ., Aquatic Toxicology, 2014, 146, 82— 92 |
| [11] | de Oliveira F. G., Lirola J. R., Salgado L. D., de Marchi G. H., Mela M., Padial A. A., Guimaraes A. T. B., Cestari M. M., de Assis H. C. S ., Science of the Total Environment, 2019, 667, 371— 383 |
| [12] | Sanchez-Hernandez J. C., del Pino J. N., Capowiez Y., Mazzia C., Rault M ., Science of the Total Environment, 2018, 612, 1407— 1416 |
| [13] | Kokushi E., Uno S., Pal S., Koyama J ., Environmental Toxicology, 2015, 30( 3), 253— 260 |
| [14] | Hsieh B. H., Deng J. F., Ger J., Tsai W. J ., Neurotoxicology, 2001, 22( 4), 423— 427 |
| [15] | Carnevali O., Notarstefano V., Olivotto I., Graziano M., Gallo P., Di Marco Pisciottano I., Vaccari L., Mandich A., Giorgini E., Maradonna F ., Aquatic Toxicology, 2017, 185, 95— 104 |
| [16] | Fernandez-Cisnal R., Garcia-Sevillano M. A., Garcia-Barrera T., Gomez-Ariza J. L., Abril N ., Aquatic Toxicology, 2018, 205, 76— 88 |
| [17] | Hur J. H., Manoharan S., Hur K. J., Kim J ., Toxicology Letters, 2018, 295, S177 |
| [18] | Butcherine P., Benkendorff K., Kelaher B., Barkla B. J ., Chemosphere, 2019, 217, 329— 348 |
| [19] | Sarkar A., Ray D., Shrivastava A. N., Sarker S ., Ecotoxicology, 2006, 15( 4), 333— 340 |
| [20] | Benli A. C. K., Selvi M., Sepici-Dincel A., Sarikaya R., Yildirim M. Z., Ozkul A., Erkoc F. , Journal of Environmental Protection and Ecology, 2009, 10( 1), 104— 109 |
| [21] | Zhang L. Q., Wang J., Li T., Li P. Y., Wang Y. H., Yang M., Liu J. P., Liu J. H ., Experimental and Therapeutic Medicine, 2019, 17( 5), 3789— 3799 |
| [22] | Schoiswohl G., Eder S., Haemmerle G., Schweiger M., Lass A., Zimmermann R., Zechner R ., Atherosclerosis Supplements, 2007, 8( 1), 231 |
| [23] | Yang Y., Dong F. S., Liu X. G., Xu J., Wu X. H., Qi S. Z., Liu W. X., Zheng Y. Q ., Science of the Total Environment, 2018, 633, 1227— 1236 |
| [24] | Sun L. B., Li J. S., Zuo Z. H., Chen M., Wang C. G ., Aquatic Toxicology, 2013, 126, 148— 153 |
| [25] | Teng M. M., Zhao F., Zhou Y. M., Yan S., Tian S. N., Yan J., Meng Z. Y., Bo S., Wang C. J ., Journal of Agricultural and Food Chemistry, 2019, 67( 16), 4623— 4631 |
| [26] | Wang X. Y., Shen M. L., Zhou J. J., Jin Y. X ., Comparative Biochemistry and Physiology C-Toxicology & Pharmacology, 2019, 216, 19— 28 |
| [27] | Mesnage R., Biserni M., Genkova D., Wesolowski L., Antoniou M. N ., Journal of Applied Toxicology, 2018, 38( 12), 1483— 1491 |
| [1] | XIE Yan, CHEN Jia, XU Bin, YAN Long, TANG Jijun, XIE Jianwei. Studies on Poisoning Characteristics of Phosphylated Oxime on AChE and Efficacy of Reactivators Based on Quantitative Determination of Effect Biomarkers by Liquid Chromatograph-mass Spectrometry† [J]. Chem. J. Chinese Universities, 2017, 38(5): 758. |
| [2] | LI Xue, FANG Xiao-Wei, LI Yin-Ping, CHEN Huan-Wen. Detection of Hydroxylated Metabolites of Polycyclic Aromatic Hydrocarbons by Electrospray Ionization Ion Trap Tandem Mass Spectrometry [J]. Chem. J. Chinese Universities, 2013, 34(8): 1840. |
| [3] | ZHAO Qiang, SUN Xiao-Hong, LU Ying, PAN Ying-Jie, ZHAO Yong. Application of Metabolic Profiling for Distinguishing Different Pathogenic Vibrio Parahaemolyticus [J]. Chem. J. Chinese Universities, 2012, 33(08): 1686. |
| [4] | WANG Wei-Hua, LIU Chun-Hong, SUN Yuan-Ming*, LIN Feng*, ZHANG Ming-Ming, WANG Zhao-Bin, ZHANG Min-Yi. Metabolic Profiles of Nonylphenol in Rat Urine [J]. Chem. J. Chinese Universities, 2011, 32(10): 2280. |
| [5] | LI Guo-Chen , WANG Yan-Hong*, WU Ren-An, WANG Shi-Cheng. MALDI-TOF-MS for Lipidomics Analysis——Potential Biomarker for Cadmium Effect on Crucian Carp(Carassius auratus) [J]. Chem. J. Chinese Universities, 2010, 31(2): 269. |
| [6] | ZHAO Hui-Hui, YANG Fan, WANG Wei*, WANG Hong-Xia, WEI Kai-Hua*. Label Free Proteome Analysis of Plasma from Unstable Angina with Blood Stasis Syndrome Patients [J]. Chem. J. Chinese Universities, 2010, 31(2): 285. |
| [7] | HAN Li-Da, LIANG Qiong-Lin, WANG Yi-Ming, LUO Guo-An*. Serum EFAs and NEFAs Metabolic Profiling Analysis Child-bearing Age Women and Its Application to NTDs Preventive Nutrition Intervention [J]. Chem. J. Chinese Universities, 2010, 31(1): 46. |
| Viewed | ||||||
|
Full text |
|
|||||
|
Abstract |
|
|||||